
- IntelliJ IDEA: 2024.1+ (Community & Ultimate editions) available on the JetBrains Marketplace as Siglo Workflows (
io.siglo.idea). - Visual Studio Code: 1.90+ (Desktop & Remote Workspace hosts) available on the VS Code Marketplace as Siglo Workflow Explorer (
jsoftgem.siglo-workflow-explorer).
[!NOTE] Static IDE Explorer vs. Live DevTools: The IDE Workflow Explorer performs pure static AST analysis of your TypeScript/JavaScript source code without running your application or connecting to external services. For runtime execution streaming, event waterfall timelines, and interactive replay, see Live Monitoring & DevTools.
1. Zero-Execution Static Architecture
Unlike traditional runtime reflection tools that dynamically evaluate orimport() user code, the Siglo Workflow Explorer operates on an out-of-process, zero-execution AST analyzer (@siglo/ide-analysis):
Safety & Resilience Guarantees:
- Zero Module Imports: Application files are never executed. Database connections, network sockets, cloud SDKs, and top-level side effects never run during analysis.
- Fail-Safe Opening: Untrusted repositories and production workflow definitions can be inspected safely without risk of arbitrary code execution.
- Workspace Trust Gating: Both the IntelliJ plugin and VS Code extension integrate with their platform’s Workspace Trust framework, preventing background analyzer processes from spawning on untrusted projects.
- Deterministic Coordinates: Normalized Unicode source line and column ranges are attached to every node and edge, guaranteeing accurate click-to-definition navigation across platforms.
- Process Isolation & Crash Recovery: The analyzer daemon runs as an isolated Node.js child process with built-in timeouts and automated restart upon crash.
2. Key Visualizer Features
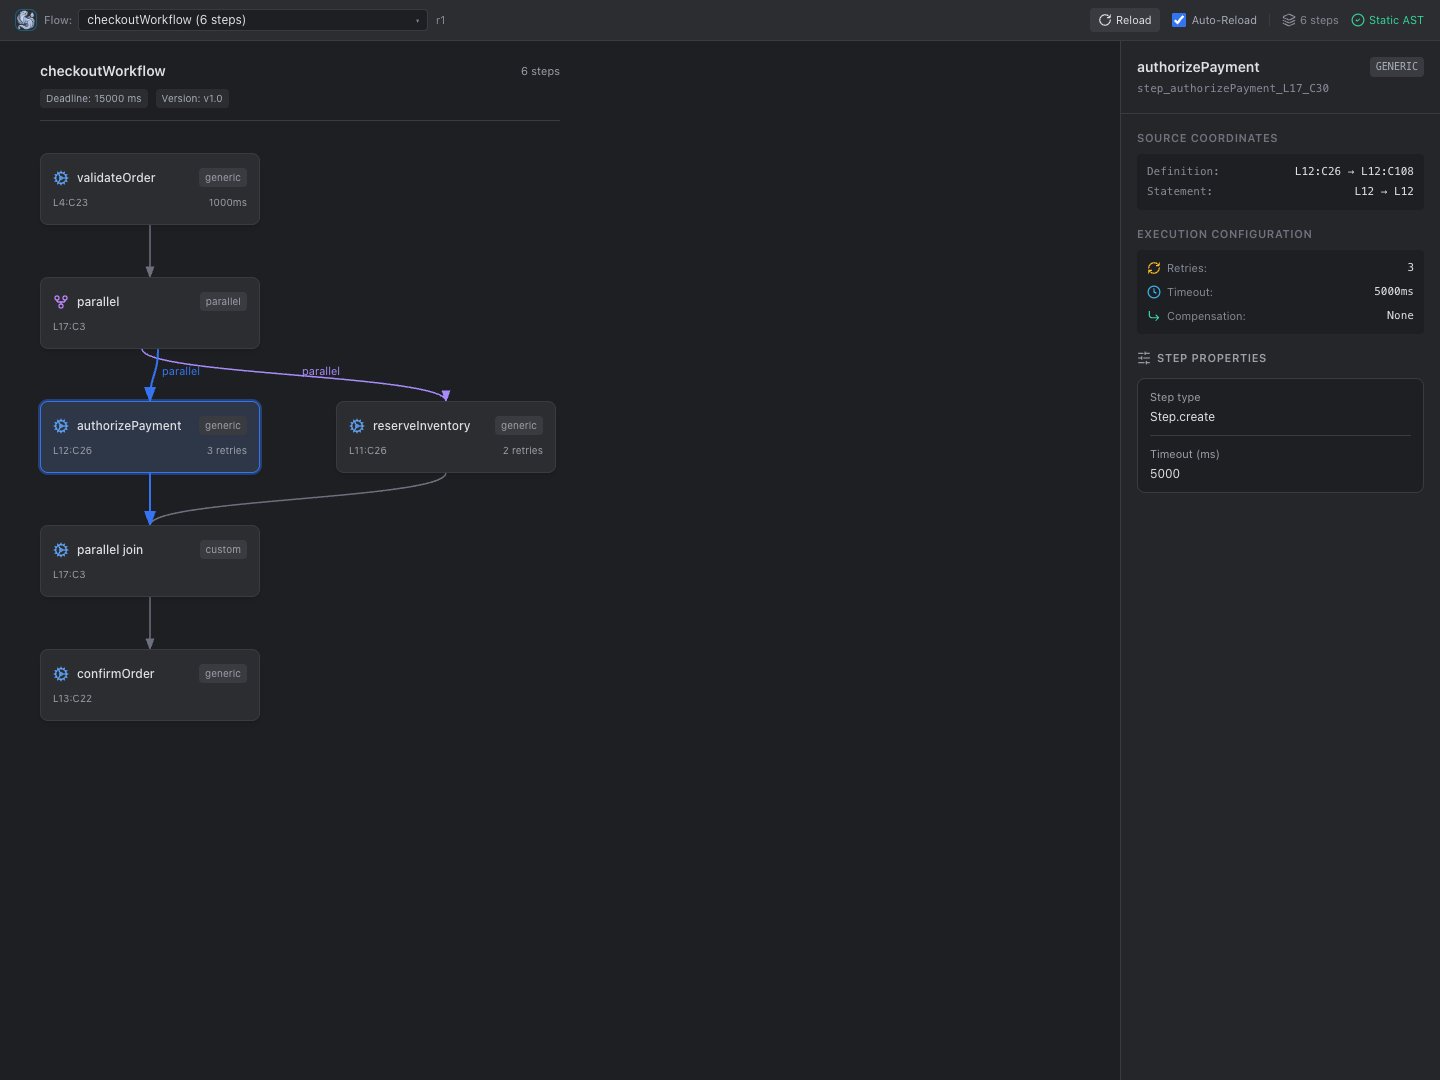
1. Longest-Path Layered DAG Visualizer
- Automatically arranges workflow steps from top to bottom using a longest-path layering algorithm.
- Displays explicit visual hubs for parallel forks and joins (
parallel,allSettled,race,branch,when,map). - Differentiates edge types with distinct visual styles and colors:
- Sequential: Solid slate connecting lines.
- Parallel / Race: Blue accent lines connecting fork and join hubs.
- Branch / When: Purple lines labeled with branch keys (e.g.
SUBPRIME / default). - Compensation: Amber dashed lines indicating saga rollback paths.
- Fallback: Rose dashed lines indicating error recovery steps.
- Interactive controls allow smooth zoom, pan, and fit-to-view centering.
2. Structured Step Input Contracts & Schema Inspector
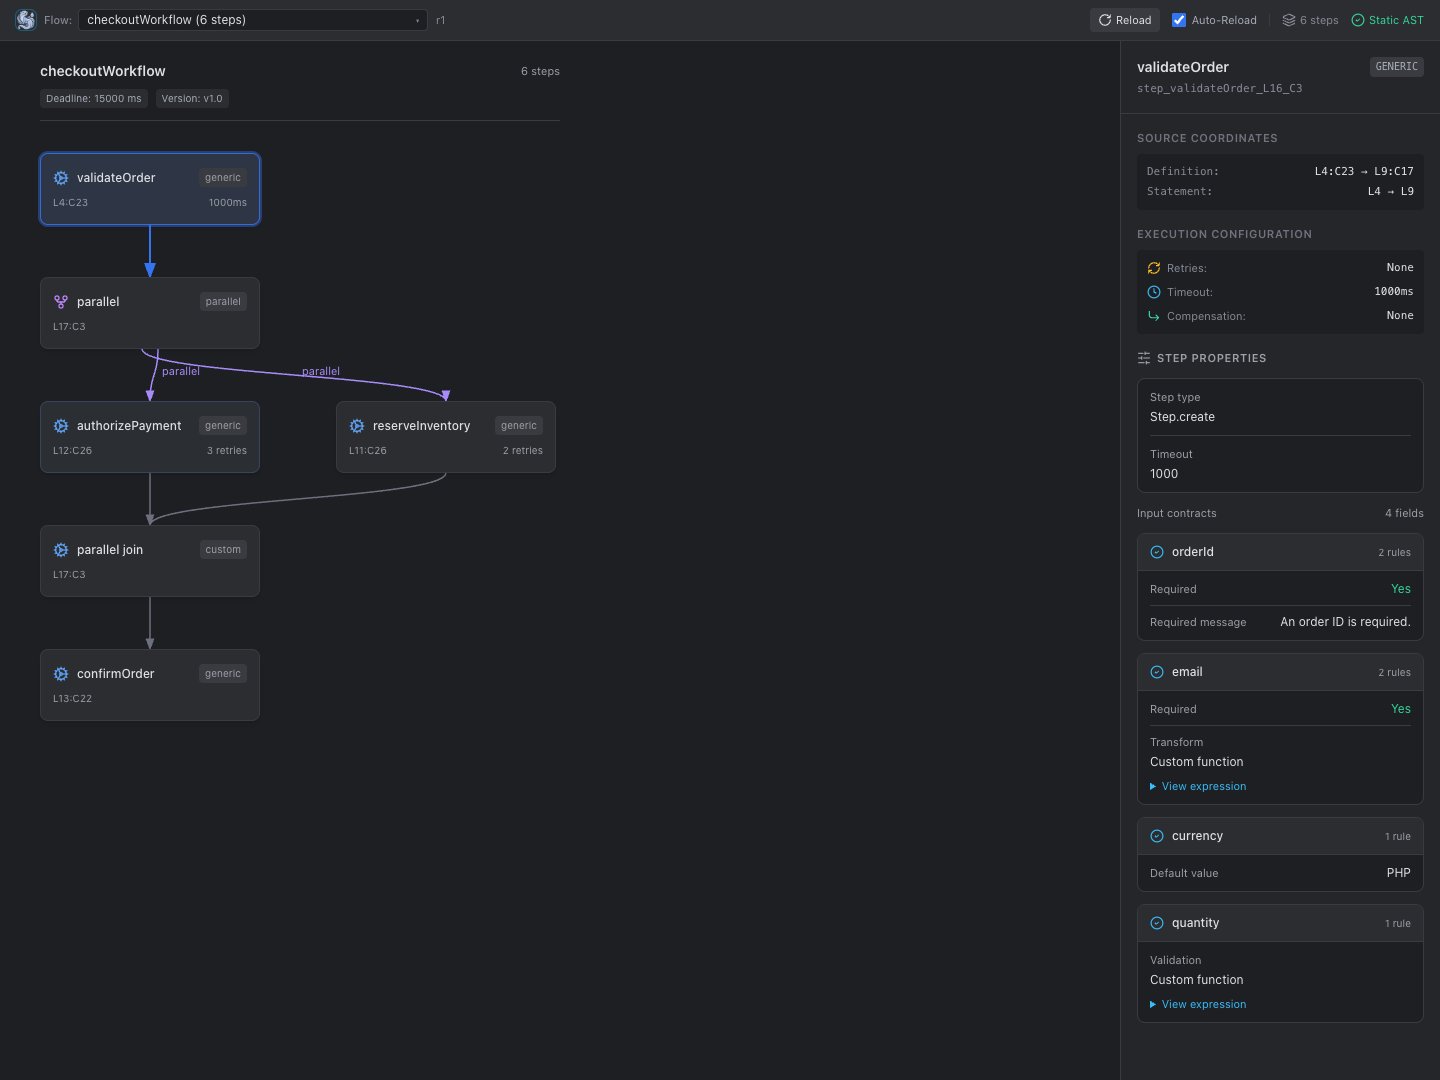
Selecting any step in the visual graph opens the Inspector Panel:- Field-Grouped Specs: Fluent
.spec(...)and.schema(...)rules are parsed and grouped into dedicated field cards. - Validation Rules: Shows required fields (
*), default values, validator functions, and exception error messages. - Transformations & Translations: Inspects value transformers and translators with expandable source code snippets.
- Root Schemas: Whole-input validation schemas (e.g. Zod, Standard Schema) are displayed under the
$root$contract card.
3. Workflow-Level Metadata & Network Policies
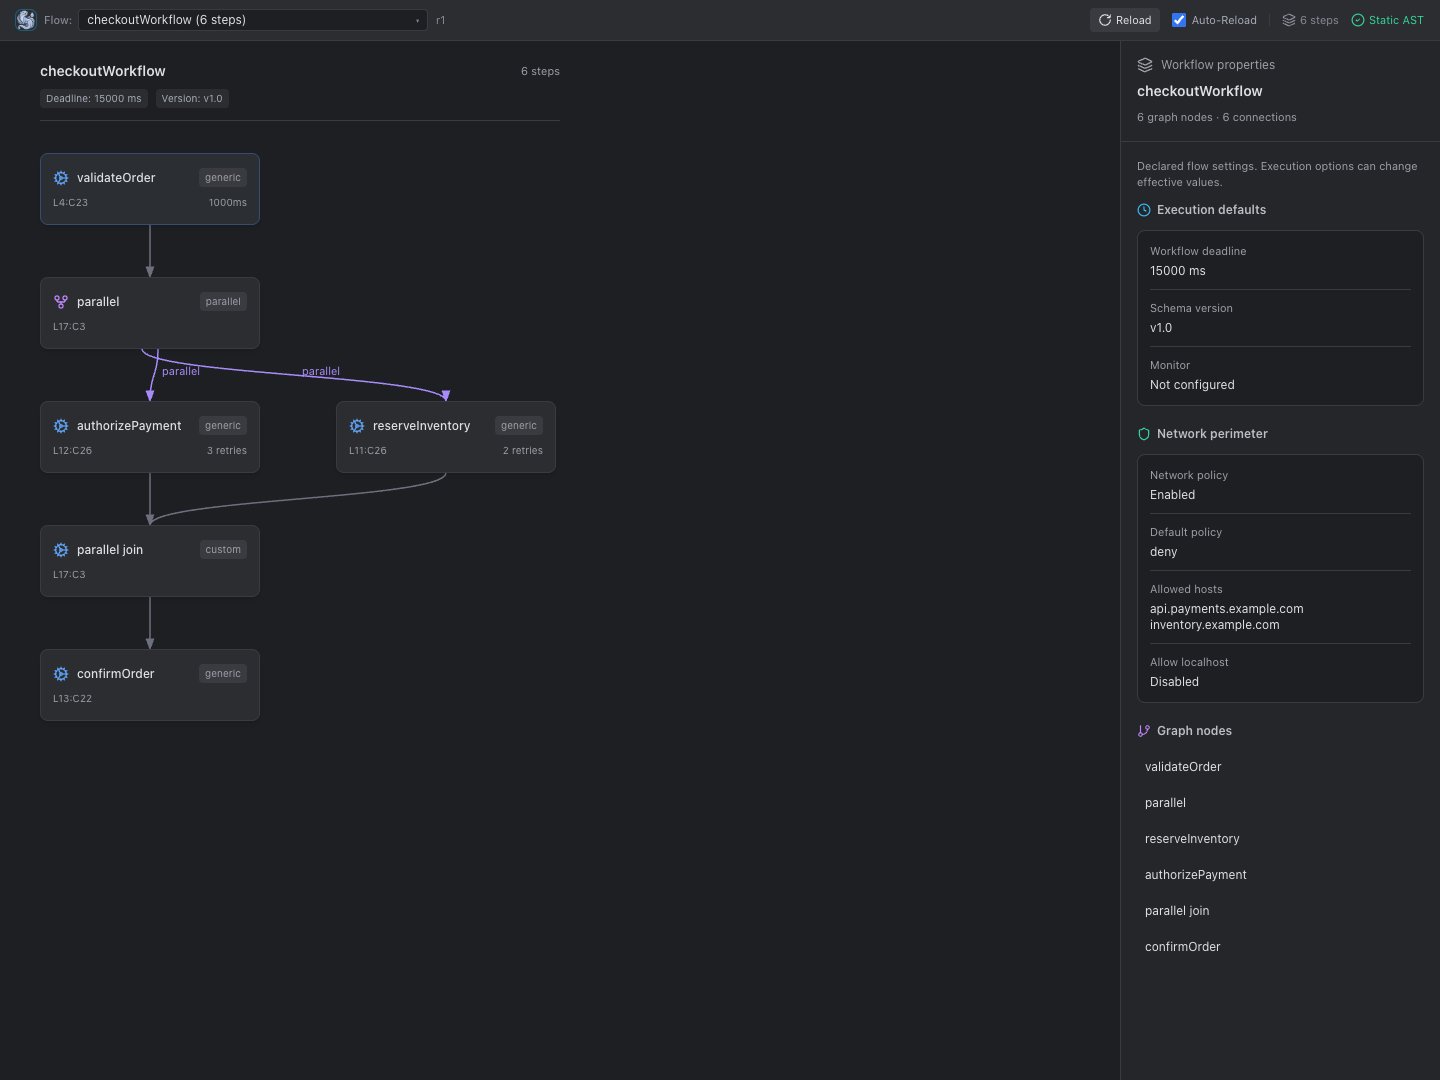
- Execution Badges: Workflow deadlines (
.timeout(...)), schema versions (.version(...)), and custom tags appear directly above the graph canvas. - Workflow Inspector: Clicking the workflow header reveals execution settings, declared network perimeter policies (
hosts,allowLocalhost), custom monitoring configurations, and a full step inventory.
4. Multi-Workflow Explorer (“All Flows” View)
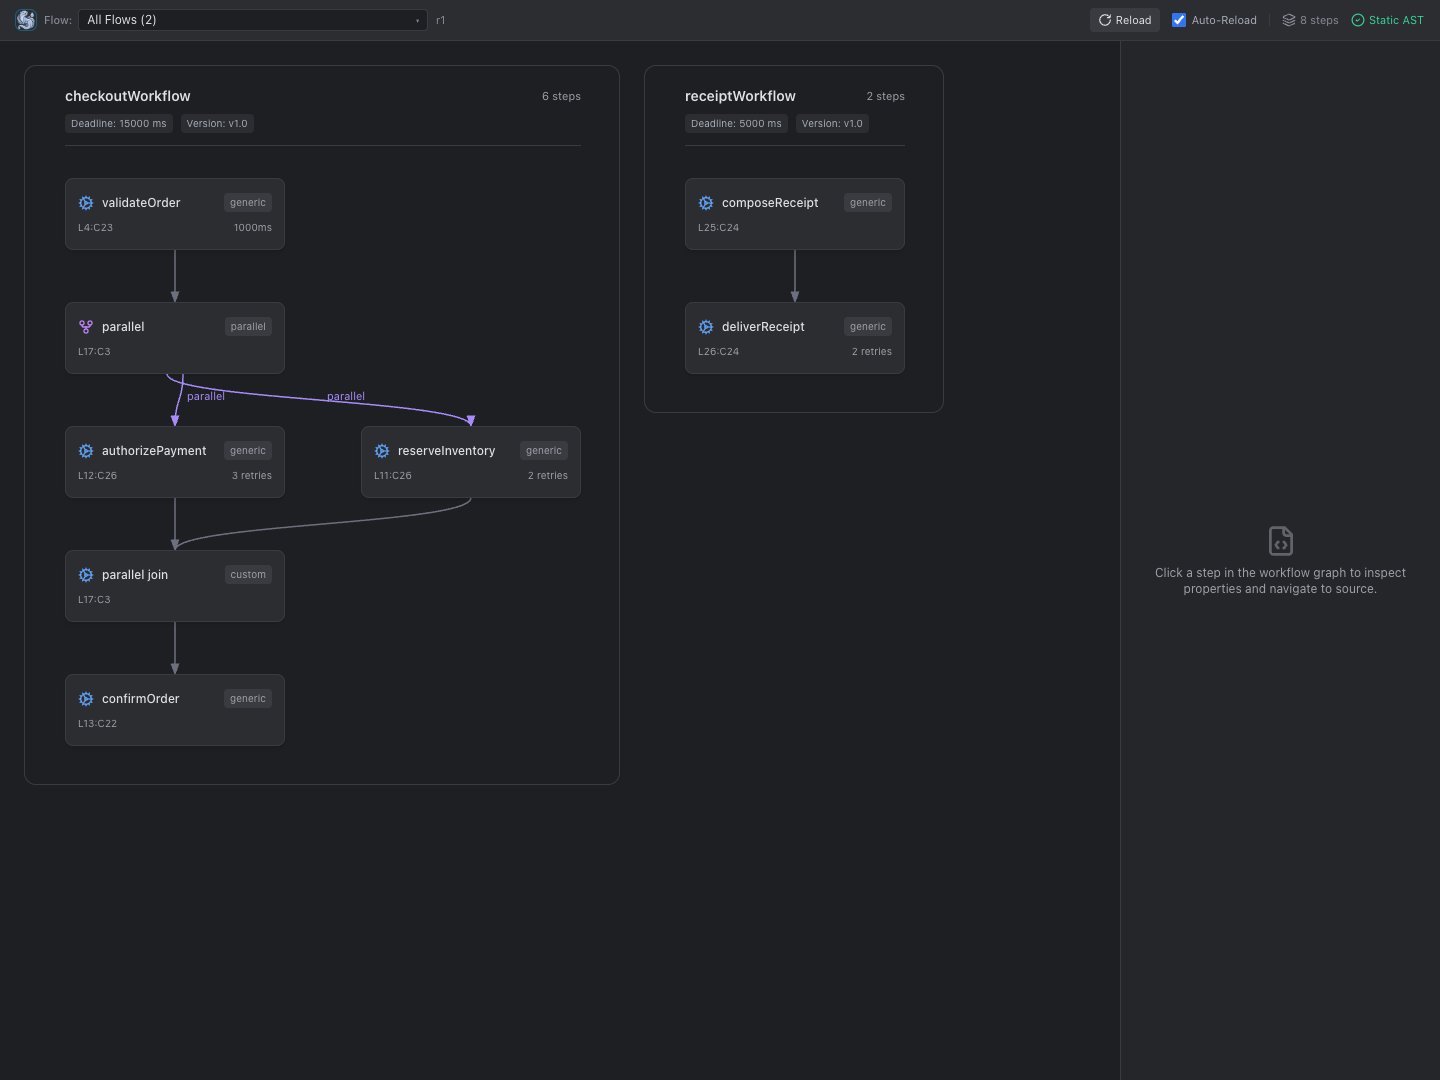
- When a file contains multiple workflow declarations (e.g.
flow1,flow2, and composedflow3 = flow(flow1, flow2)), the header dropdown allows switching between individual workflows or selecting All Flows. - In All Flows mode, each workflow is rendered in its own labeled canvas section, preserving workflow boundaries and multi-workflow composition clarity.
5. Live Typing & Bidirectional Navigation
- Click-to-Definition: Clicking any card or hub in the visualizer immediately navigates the IDE editor cursor to the exact line and character where the step is defined.
- Cursor-to-Node Tracking: Moving the editor cursor inside a step automatically highlights the corresponding node in the visualizer.
- Live Debounced Refresh: When Auto-Reload is enabled, editing the code buffer automatically updates the visual graph within 250ms of typing without requiring manual file saves.
- Active Tab Tracking: Switching editor tabs updates the tool window to display the workflows declared in the active file.
6. Responsive Layout & Native Swing Fallback
- Responsive Stacking: In narrow sidebars (such as the VS Code Activity Bar or docked IntelliJ tool windows), the Inspector automatically stacks beneath the DAG canvas for seamless visibility.
- IntelliJ Swing Fallback (
JBTree): When running in headless environments, remote development, or custom JetBrains runtimes where JCEF is disabled, the IntelliJ plugin gracefully degrades to a native Swing tree view showing the structured AST hierarchy.
3. Supported Workflow Syntax Matrix
The static analyzer extracts graph topology across core Siglo patterns and ecosystem integrations:Syntax Example
4. IntelliJ IDEA Plugin Installation
Requirements:
- IntelliJ IDEA: 2024.1+ (Community or Ultimate edition; Build 241.x through 262.x).
- Node.js: 18.0.0+ on your system
PATH. - JDK: Java 17 or 21 (for building from source; Gradle delegates to compatible daemon JVM via
gradle/gradle-daemon-jvm.properties).
Option A: Installing from JetBrains Marketplace (Recommended)
- Open IntelliJ IDEA → Settings / Preferences (
⌘,on macOS,Ctrl+Alt+Son Linux/Windows). - Go to Plugins → Select the Marketplace tab.
- Search for
Siglo Workflows(or search by Plugin IDio.siglo.idea). - Click Install, then click Restart IDE.
- Open any Siglo TypeScript/JavaScript file and access the Siglo Workflows tool window from the right-hand stripe.
Option B: Installing from Prebuilt Distribution (.zip)
- Open IntelliJ IDEA → Settings / Preferences (
⌘,on macOS,Ctrl+Alt+Son Linux/Windows). - Go to Plugins → Click ⚙️ (Gear Icon) → Install Plugin from Disk….
- Select
siglo-intellij-plugin-1.2.0.zip(located inplugins/intellij/build/distributions/). - Click Restart IDE.
- Access the Siglo Workflows tool window from the right-hand stripe.
Option C: Building from Source (Monorepo)
From the repository root:plugins/intellij/build/distributions/siglo-intellij-plugin-1.2.0.zip.
5. Visual Studio Code Extension
Requirements:
- Visual Studio Code: 1.90+ (Desktop or Remote Development hosts).
- Node.js: 18.0.0+ installed on the host system (note: the analyzer is bundled with the extension for seamless execution).
- Workspace Trust: Extension requires workspace trust to start the local static analyzer.
Option A: Installing from VS Code Marketplace (Recommended)
- Open VS Code → Go to the Extensions view (
⇧⌘Xon macOS,Ctrl+Shift+Xon Linux/Windows). - Search for
Siglo Workflow Explorer(or extension IDjsoftgem.siglo-workflow-explorer). - Click Install.
- Open your project folder and trust the workspace when prompted.
Option B: Installing from Prebuilt VSIX
- Open VS Code → Go to the Extensions view (
⇧⌘Xon macOS,Ctrl+Shift+Xon Linux/Windows). - Click Views and More Actions (
…) at the top of the Extensions view. - Select Install from VSIX….
- Choose
plugins/vscode/siglo-workflow-explorer-1.2.0.vsix. - When prompted, trust the workspace folder to activate the extension.
Option C: Building from Source (Monorepo)
From the repository root:plugins/vscode/siglo-workflow-explorer-1.2.0.vsix.
Usage & Contributed Commands:
- Sidebar Explorer: Click the Siglo icon in the Activity Bar to reveal the persistent Siglo Workflows sidebar webview.
- Editor Tab Visualizer: Open the Command Palette (
⇧⌘P/Ctrl+Shift+P) and runSiglo: Open Workflow Visualizerto inspect the active workflow side-by-side with your code. - Discover Workspace Workflows: Run
Siglo: Discover Workspace Workflowsto scan up to 100 TypeScript/JavaScript files across your workspace folders and jump directly into any declared flow.
6. Troubleshooting & Diagnostics
Node.js Runtime Discovery
When an IDE activates the extension, it locates Node.js to spawn@siglo/ide-analysis. If your system uses version managers (such as NVM, Volta, asdf, or fnm):
- Ensure Node.js 18+ is available in your shell’s default
$PATH(e.g.nvm alias default 20). - Explicit Daemon Binary: You can override analyzer discovery by setting the
SIGLO_ANALYZER_BINenvironment variable or the JVM system property-Dsiglo.analyzer.bin=/path/to/packages/ide-analysis/dist/bin.js.
Running on JDK 25 Environments (IntelliJ)
The IntelliJ plugin includesgradle/gradle-daemon-jvm.properties configured for JDK 21. If your default shell uses JDK 25+ (e.g. GraalVM CE 25), Gradle automatically delegates to a compatible daemon JVM, avoiding JavaVersion.parse Kotlin DSL incompatibility. You can also specify JAVA_HOME explicitly:
JCEF Disabled / Showing AST Tree Fallback (IntelliJ)
In customized headless environments or remote development agents where JCEF is unavailable, the plugin automatically switches to the native SwingJBTree view. If running desktop IntelliJ and you wish to use the graphical webview, ensure your IDE is running on the default bundled JetBrains Runtime (JBR) with JCEF enabled.
Untrusted Workspace Notification
If the visualizer displays a blank screen or prompts that analysis is paused, check your IDE’s Workspace Trust status:- In IntelliJ: Click Trust Project on the yellow notification banner.
- In VS Code: Run Manage Workspace Trust from the Command Palette and select Trust.
7. Related Documentation
- Live Monitoring & DevTools — Real-time execution streaming, latency waterfalls, and interactive replay.
- Execution Semantics Contract — Formal runtime execution semantics, lifecycle phases, and context accumulation.
- Ecosystem DevTools and Offline Testing — Inspection protocols for HTTP, AI, webhook, and notification steps.
- IntelliJ Plugin Roadmap — Architecture and upcoming milestones for the IntelliJ plugin.
- VS Code Extension Roadmap — Architecture and upcoming milestones for the VS Code extension.