
500, but it doesn’t tell you whether stock was reserved, payment was retried, or shipping caused the failure.
In this tutorial, we’ll expose the checkout from Getting Started through an Express REST endpoint and attach Siglo’s live monitor. We’ll send real HTTP requests, inspect the named steps, and compare a successful checkout with a failed one.
The demo runs locally with fake inventory, payment, and shipping services. The API listens on port 3000, and the monitoring dashboard listens on 4000. Both run in the same Node.js process and share an event emitter.
1. How the Pieces Fit Together
The REST adapter maps HTTP input to workflow context and workflow output to an HTTP response. The monitor observes execution events. Monitoring doesn’t create the business endpoint or start a workflow by itself; we connect the two explicitly.2. Install and Start
If you followed the previous tutorial, keepcheckout.ts and checkout-demo.ts in the same directory. The first exports createCheckout; the second exports fake services for this local demo.
Install the additional dependencies:
examples/src/getting-started. With repository dependencies installed, run these commands from the repository root:
3. Connect the Endpoint to the Monitor
Createcheckout-server.ts alongside the other two files:
createMonitorServer(...)starts one monitor at application startup..monitor(monitor.emitter)sends this checkout’s events to that monitor.sigloExpressMiddleware(checkout, ...)executes the checkout for the HTTP request.inputselects business fields;outputreturns a small public response instead of the full workflow context.namespace: 'checkout-demo'groups these executions in the monitor.
400 without reserving stock or recording a workflow run. The workflow retains its own validation too, so callers outside HTTP still get those checks.
A fresh set of fake services is created for each request so the demo’s payment-attempt counter belongs to that checkout. In a real application, inject reusable service clients without sharing mutable request state.
4. Send a Successful Request
Open http://127.0.0.1:4000 in your browser before sending the request. In another terminal, run:201 Created, echoes X-Correlation-Id, and includes an X-Workflow-Stack-Id header. Its JSON body is:
5. Inspect the Execution
Select the new execution in the dashboard. Use its stack ID from the response header to identify the exact run. If it hasn’t appeared, click Refresh workflows in the top-right corner.
The demo is fast, so you may see the completed run rather than watching each transition as it happens. Its recorded events still show the retry.
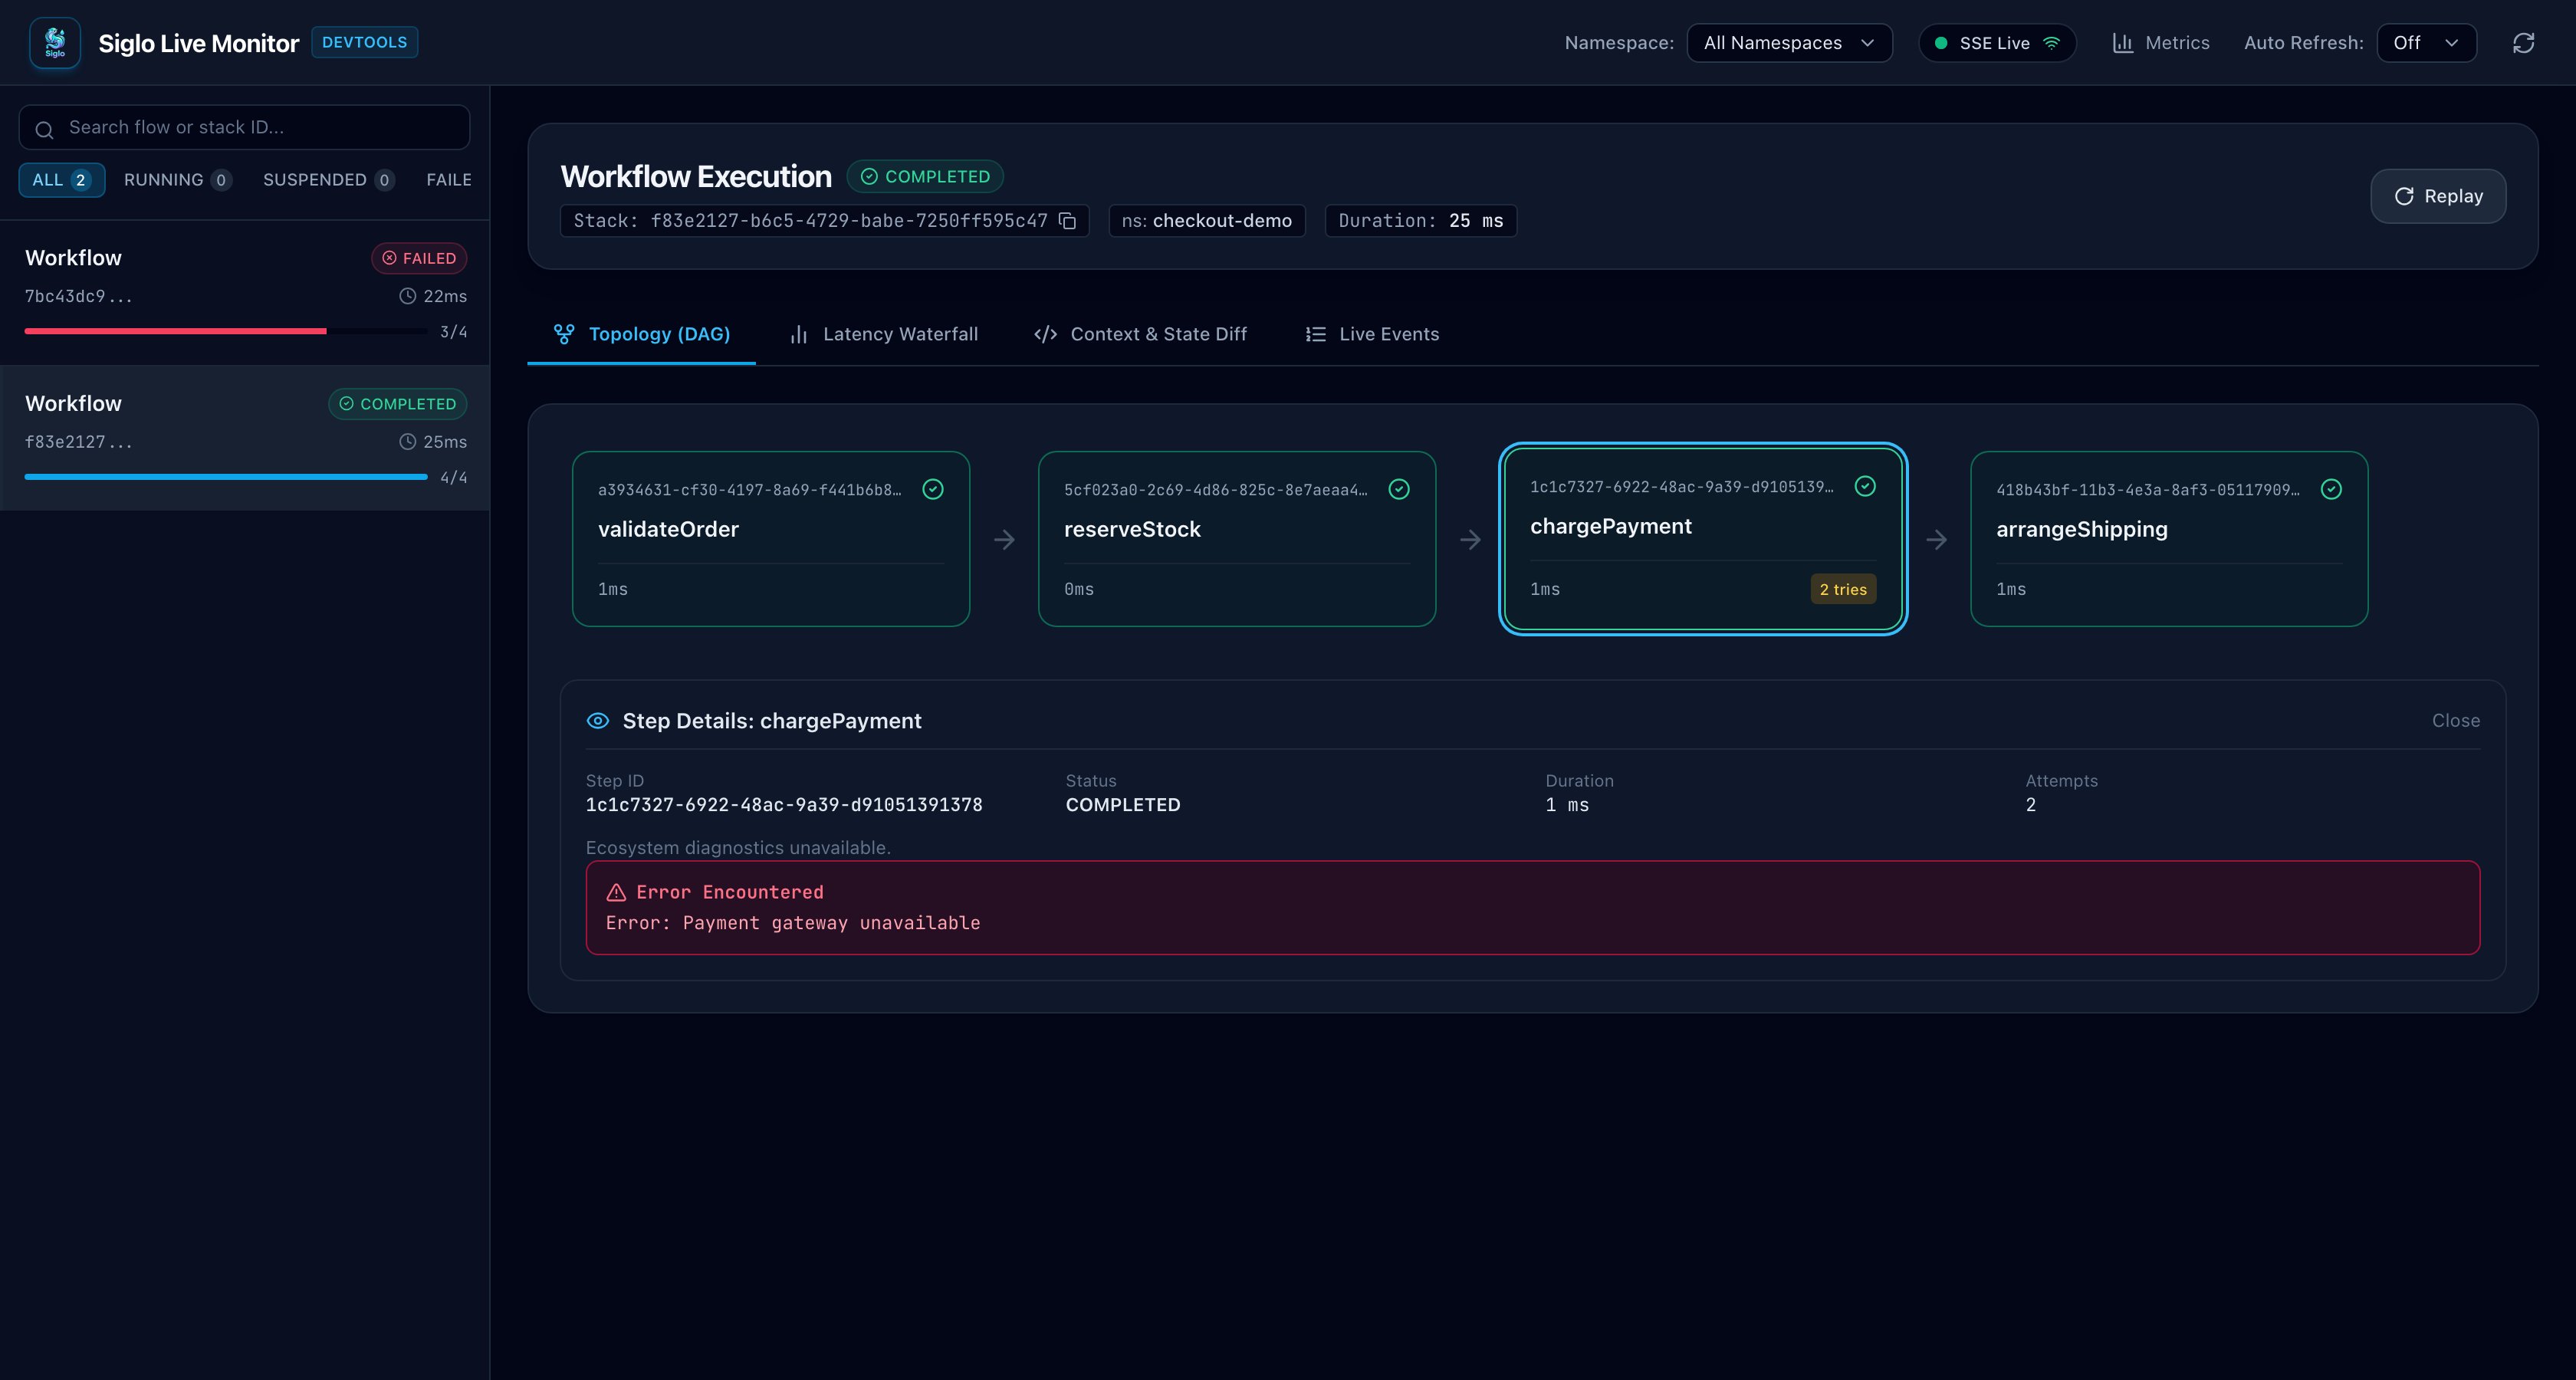
These screenshots show the dashboard running the local checkout demo. Your execution IDs and timings will differ.
In Topology (DAG), select
chargePayment to inspect its two attempts. The run is COMPLETED; the payment error shown in the step details belongs to the first attempt, before the retry succeeded.
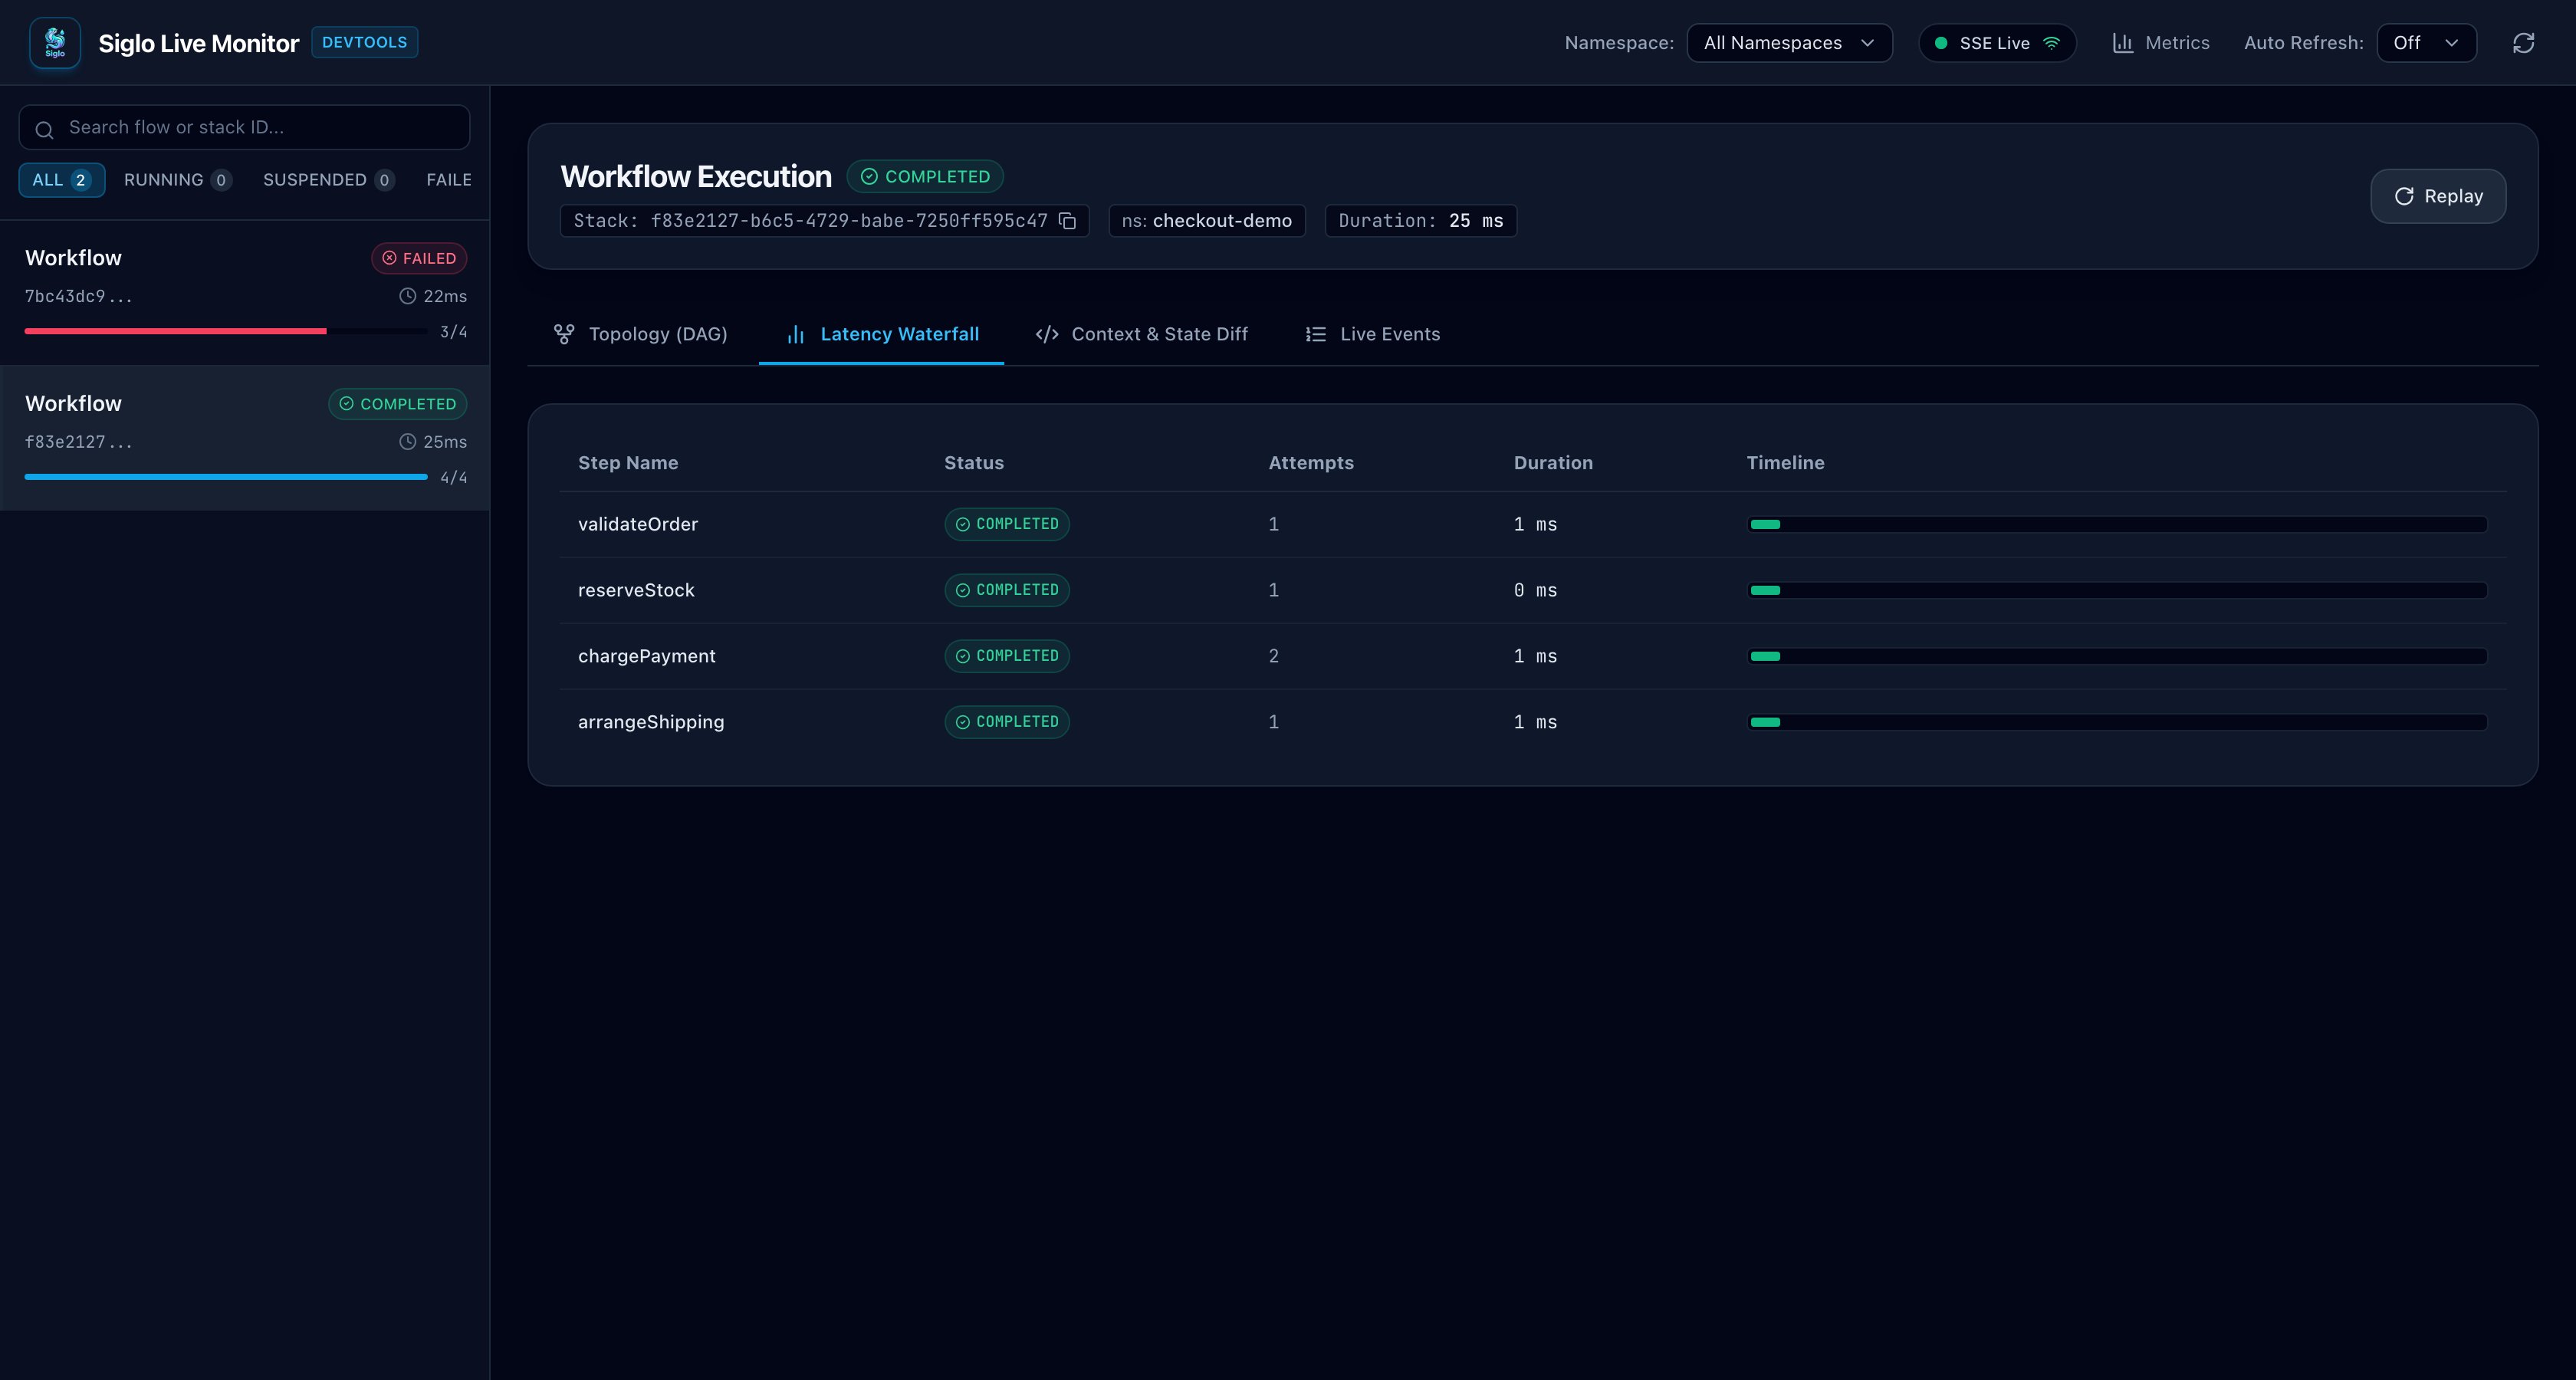
reservationId, paymentId, and trackingId.
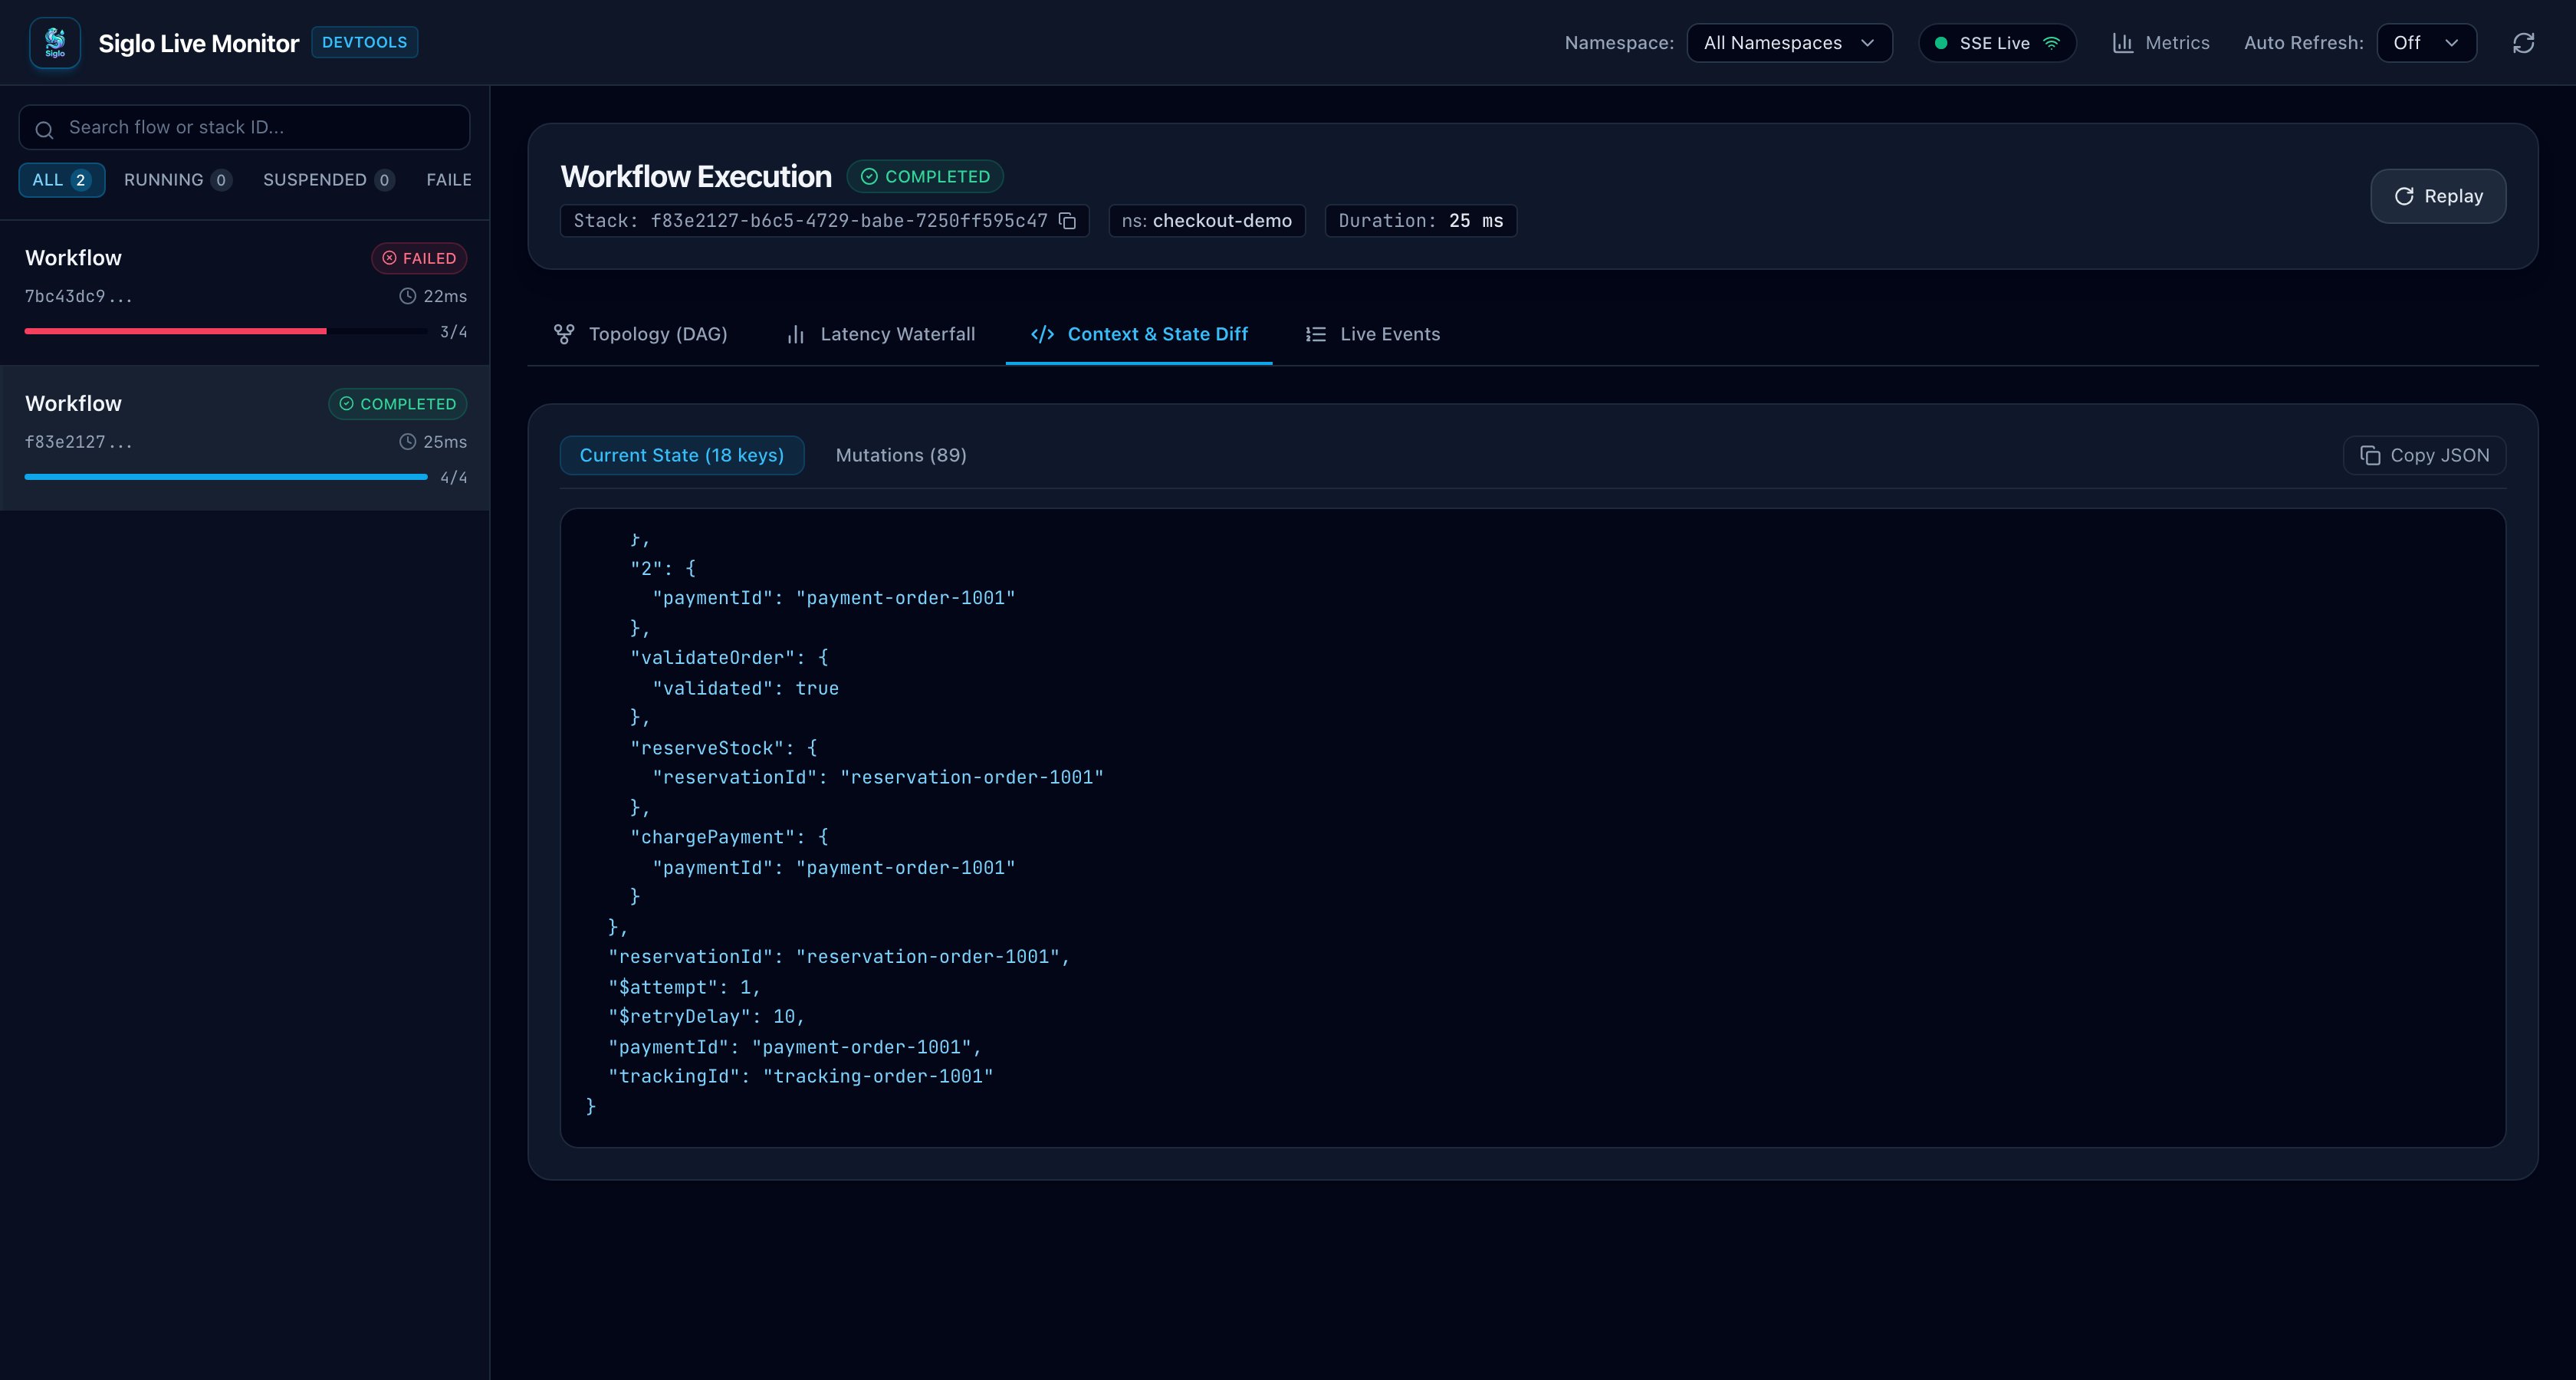
STACK_ID with the X-Workflow-Stack-Id from the successful response:
Subscribe to Live Events
In a separate terminal, start the SSE stream before sending another checkout:flow:start, step:start, step:retry, step:complete, and flow:complete. This stream shows new events; use the workflow detail API for recorded execution history. Press Ctrl+C to disconnect.
Read Metrics
siglo_flow_executions_total and siglo_step_retries_total. These counters belong to this monitor instance and reset when it restarts. For scraping and dashboards, continue with Prometheus and Grafana.
6. Trigger a Shipping Failure
The demo-onlyfailShipping=true query flag simulates a courier rejecting the shipment after payment succeeds:
500 with:
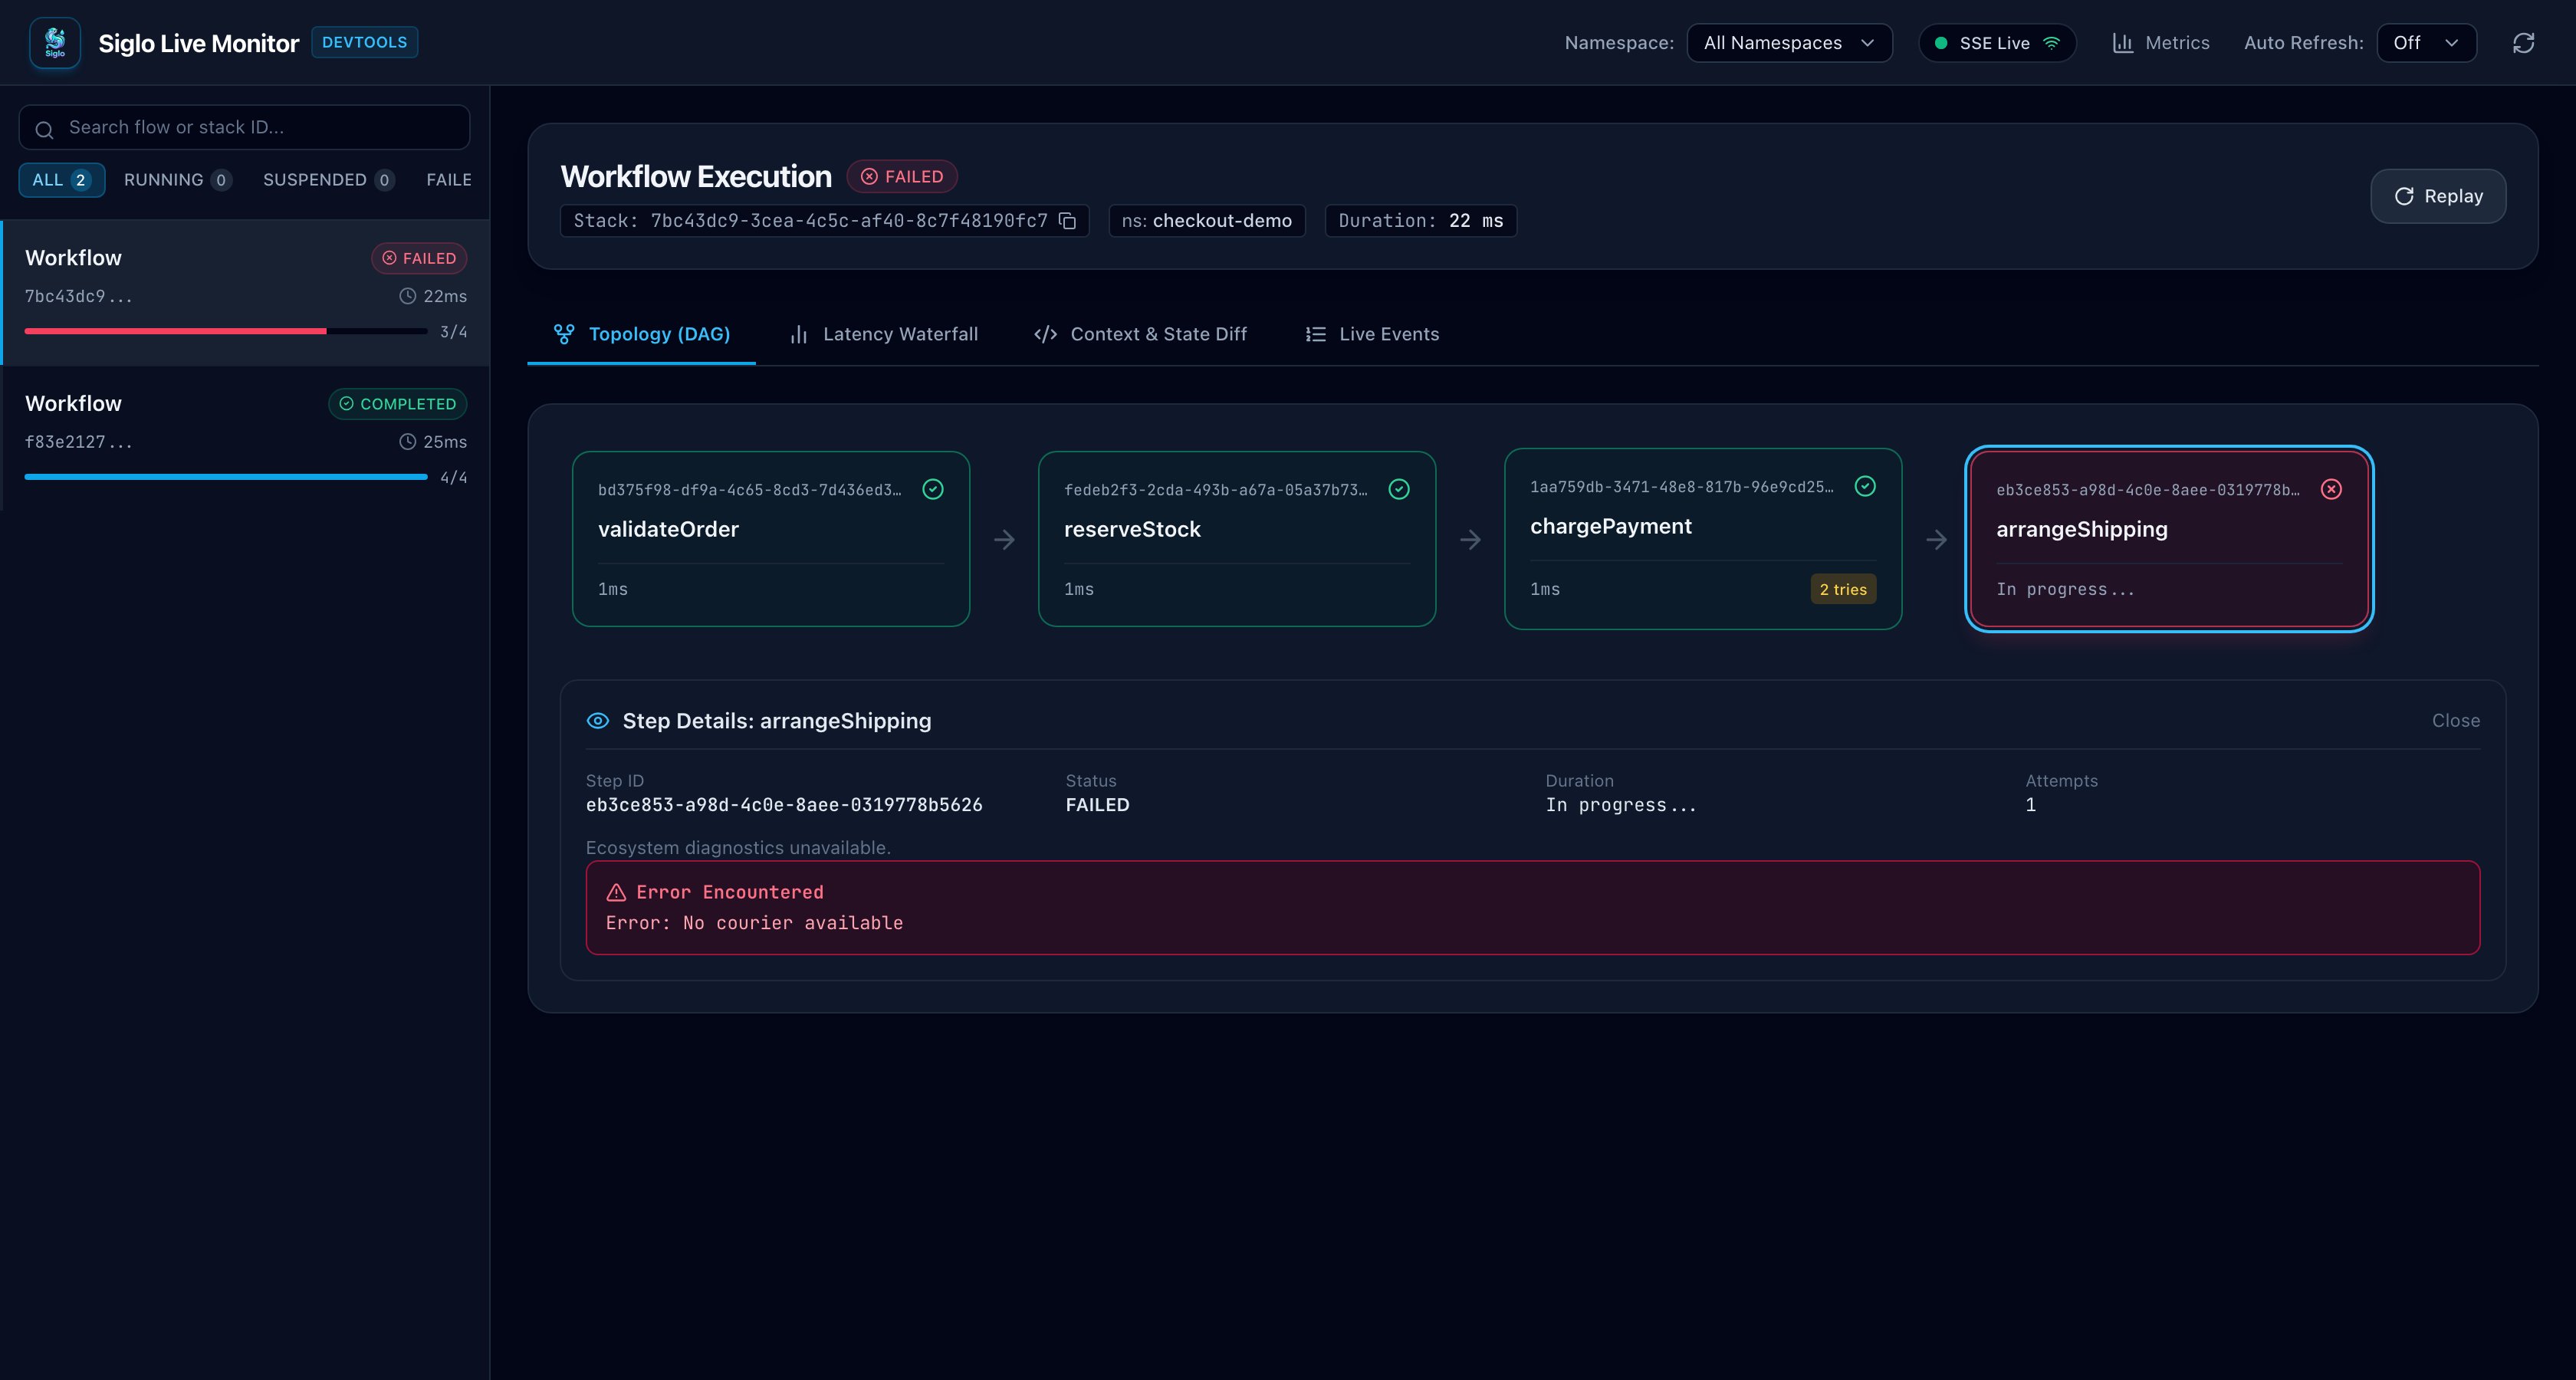
exposeErrorDetails: false keeps internal workflow error messages out of this response. Select the failed run in the monitor to inspect the shipping failure. The server console shows the business cleanup:
FAILED execution, and click arrangeShipping in Topology (DAG). Its step details show the internal error, No courier available, while the public HTTP response above stays generic.
quantity to 0: that request returns 400 at the HTTP boundary and doesn’t add a workflow run.
7. Verify the Integration
The HTTP integration test starts both servers on available ports and exercises the real endpoint. From the repository root, after building the packages, run:8. Take It Beyond the Local Demo
For a production endpoint, replace the fake clients, remove the failure flag, derive prices from trusted order records, and authenticate callers before running the workflow. Select a namespace from trusted application identity when serving multiple tenants. This endpoint executes each accepted request as a new workflow run. The correlation header helps trace a request; it doesn’t deduplicate it. Add workflow idempotency and provider-side payment keys using the checkout idempotency walkthrough. For custom execution options beyond the Express adapter’s interface, callcheckout.run(input, options) from your route and map the response explicitly.
The monitor binds to loopback here, keeps execution history in memory, and disables interactive resume/replay with allowRemoteResume: false. Before making it remotely accessible, configure authentication and telemetry redaction using the monitor deployment guide. Business-field allowlisting reduces accidental data collection, but real provider results also need review for sensitive fields.
To observe workers in another process, attach a remote monitor client instead of sharing an in-process emitter. For long-running work that should outlive an HTTP request, use a queue worker or a durable workflow with persistent storage and a defined status/resumption API.
Press Ctrl+C in the server terminal to close the API and monitor together.
Continue with Run Checkout Across Two Servers with PostgreSQL and Redis for shared checkpoints, cross-instance request deduplication, Redis caching, and a separate live monitor, with a complete Docker Compose setup.