
branch and when, you published orders to Kafka, let two consumers share the work, and inspected routing decisions in Siglo’s live monitor. Now you’ll use a separate APM example with its own producer, workers, workflow, PostgreSQL claims, and Redis monitor to explore traces in Jaeger and metrics in Grafana.
You’ll follow a gift order from publication through Kafka to its selected worker, compare fulfillment with review and cancellation, and distinguish a failed workflow from a successfully quarantined Kafka record. The fulfillment operations remain fake; the Kafka, PostgreSQL, and Redis connections are real. The routing model continues the previous tutorial, while all runnable APM code lives in examples/zero-code-apm-dashboards. Neither tutorial imports the other’s application code.
“Zero-code” describes the dashboards: data sources and panels are provisioned automatically. The example includes the tracing setup and workflow instrumentation. Your own application still needs those connections.
1. Follow the Telemetry Paths
OpenTelemetry carries one event’s trace across the producer and its consumer. Redis carries workflow events from both workers to the shared monitor. Prometheus scrapes that monitor’s metrics over the Docker network, and Grafana queries both backends. Kafka assigns a record to one worker in the consumer group. A trace normally contains the publisher and one worker, not both worker replicas. The selected workflow runs entirely inside that consumer process.2. Start the Independent APM Example
You need the repository checkout and Docker Compose supportingup --wait, as in the Kafka tutorial. From the repository root:
siglo-zero-code-apm-dashboards project. Its application image, Kafka and PostgreSQL volumes, database, consumer group, topics, Redis channel, and HTTP ports are separate from the Kafka routing tutorial. You can run both tutorials at the same time.
The APM project uses workers on 3400/3401, its monitor on 4400, Kafka on 39092, PostgreSQL on 5436 (apm_orders), and Redis on 6383. Its broker topics are apm.orders and apm.orders.dead-letter, with consumer group apm-order-routing-v1 and tenant apm-demo. Grafana, Prometheus, Jaeger, and OTLP retain ports 3000, 9090, 16686, and 4317/4318. Keep these ports available.
Sign in to Grafana with
admin / admin and dismiss its password-change prompt or choose a local password. Open Dashboards → Siglo APM to find the provisioned dashboards.
Find the Dashboards and Metrics
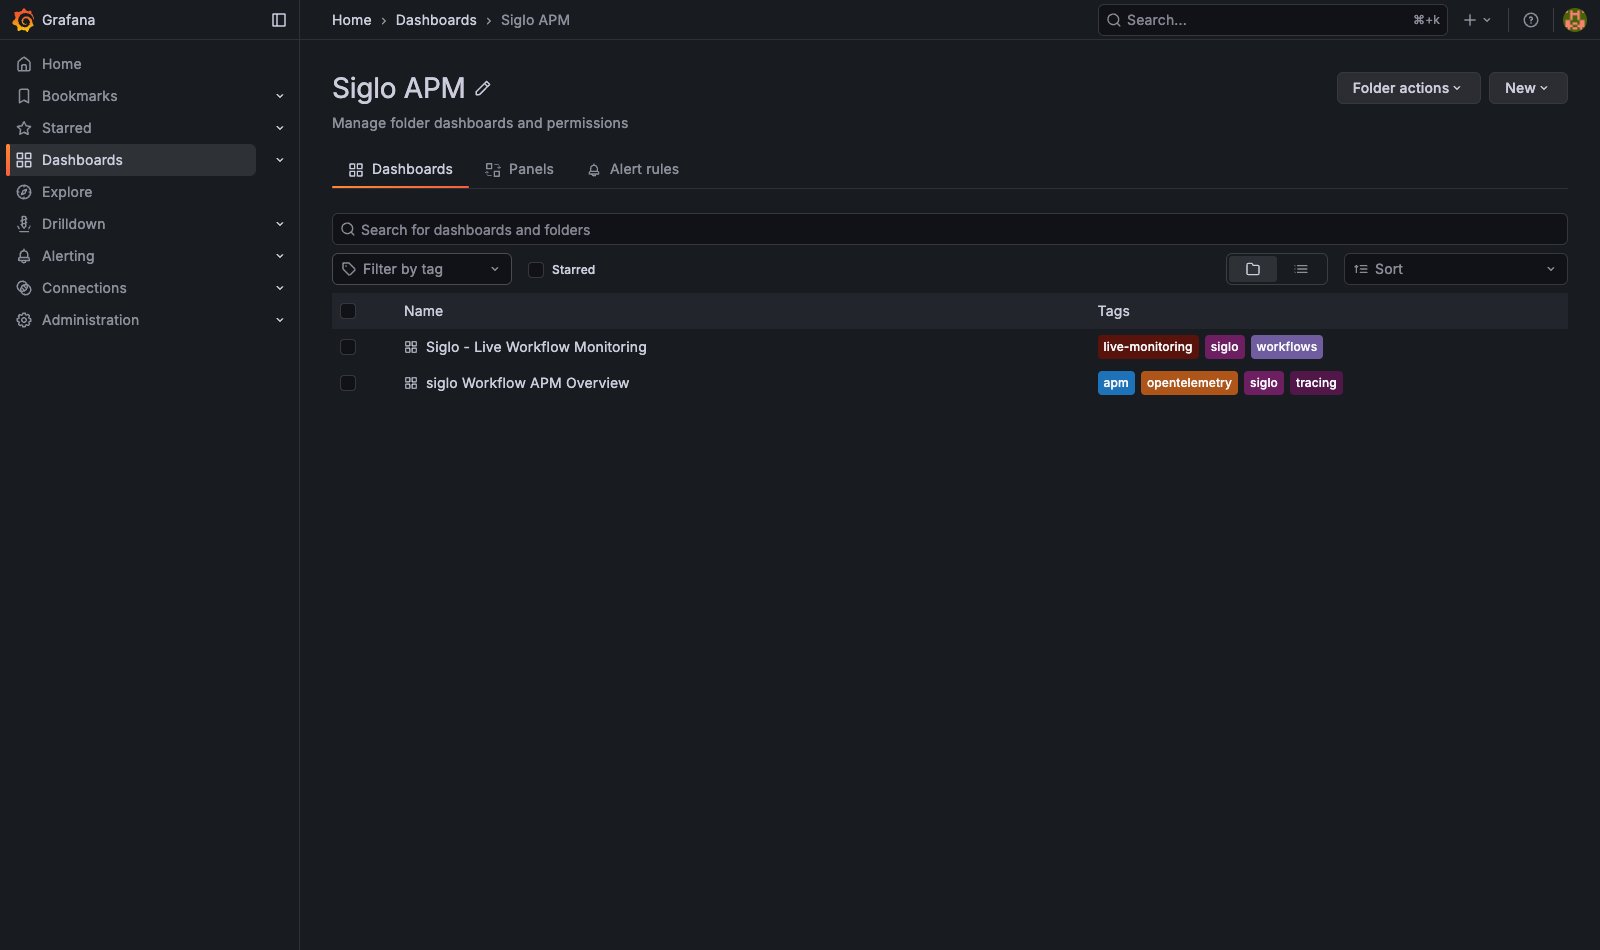
- Open Grafana, sign in, and select Dashboards in the left sidebar.
- Open the Siglo APM folder. It contains siglo Workflow APM Overview and Siglo - Live Workflow Monitoring.
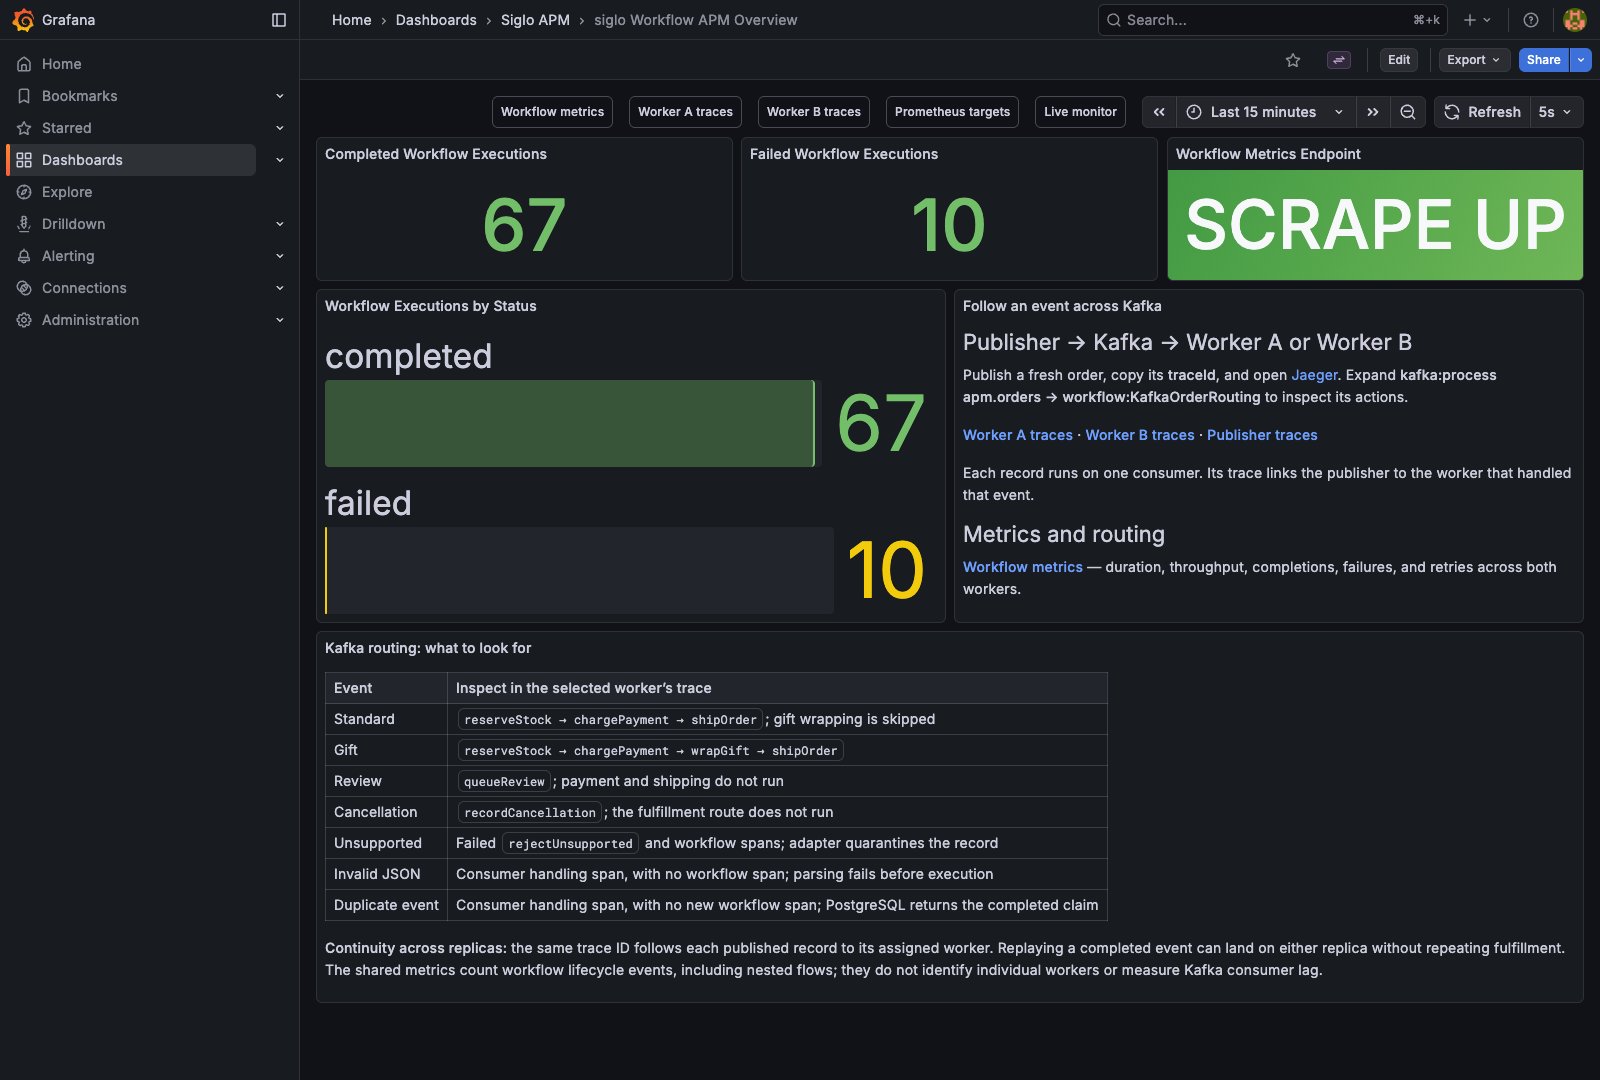
- Start with siglo Workflow APM Overview. Use its top Workflow metrics link to reach the duration, throughput, and counter panels. Worker A traces and Worker B traces open Jaeger filtered to that replica.
3. Follow a Gift Order Across Kafka
Publish using this tutorial’s own CLI:eventId, Kafka metadata, and traceId. Running the producer in worker A’s container does not choose the consumer; either replica can handle the record. The CLI initializes its own telemetry service, kafka-order-publisher.
Allow several seconds for the workers’ batch exporters to send spans. In Jaeger, select kafka-order-publisher, click Find Traces, and open the trace. You can also paste the printed trace ID into Jaeger’s trace-ID search or open http://localhost:16686/trace/<traceId>.
Expand the spans:
step:when spans inside step:branch, including the nested gift-wrapping condition. Untaken branches do not produce action spans: a standard order still has the condition’s step:when span, but no step:wrapGift. The producer span covers the Kafka send acknowledgement; it can finish before the consumer starts. The consumer span covers adapter handling, including PostgreSQL deduplication and validation, while the workflow span covers the workflow itself.
Find wrapGift and shipOrder, then inspect saveOutcome. The workflow carries siglo.workflow.name = KafkaOrderRouting; step spans carry siglo.step.name and siglo.step.attempt. These fake operations can finish in milliseconds or less, so zoom into the trace rather than expecting artificial delays.
Read /results, find the printed event ID, and compare handledBy with the service name on the consumer span. Open the same run in the live monitor to inspect its green routing paths and context. The original Kafka tutorial’s screenshots show those decisions.
4. Compare Routing and Failure Outcomes
Repeat the publisher command, changing its final argument:
For example:
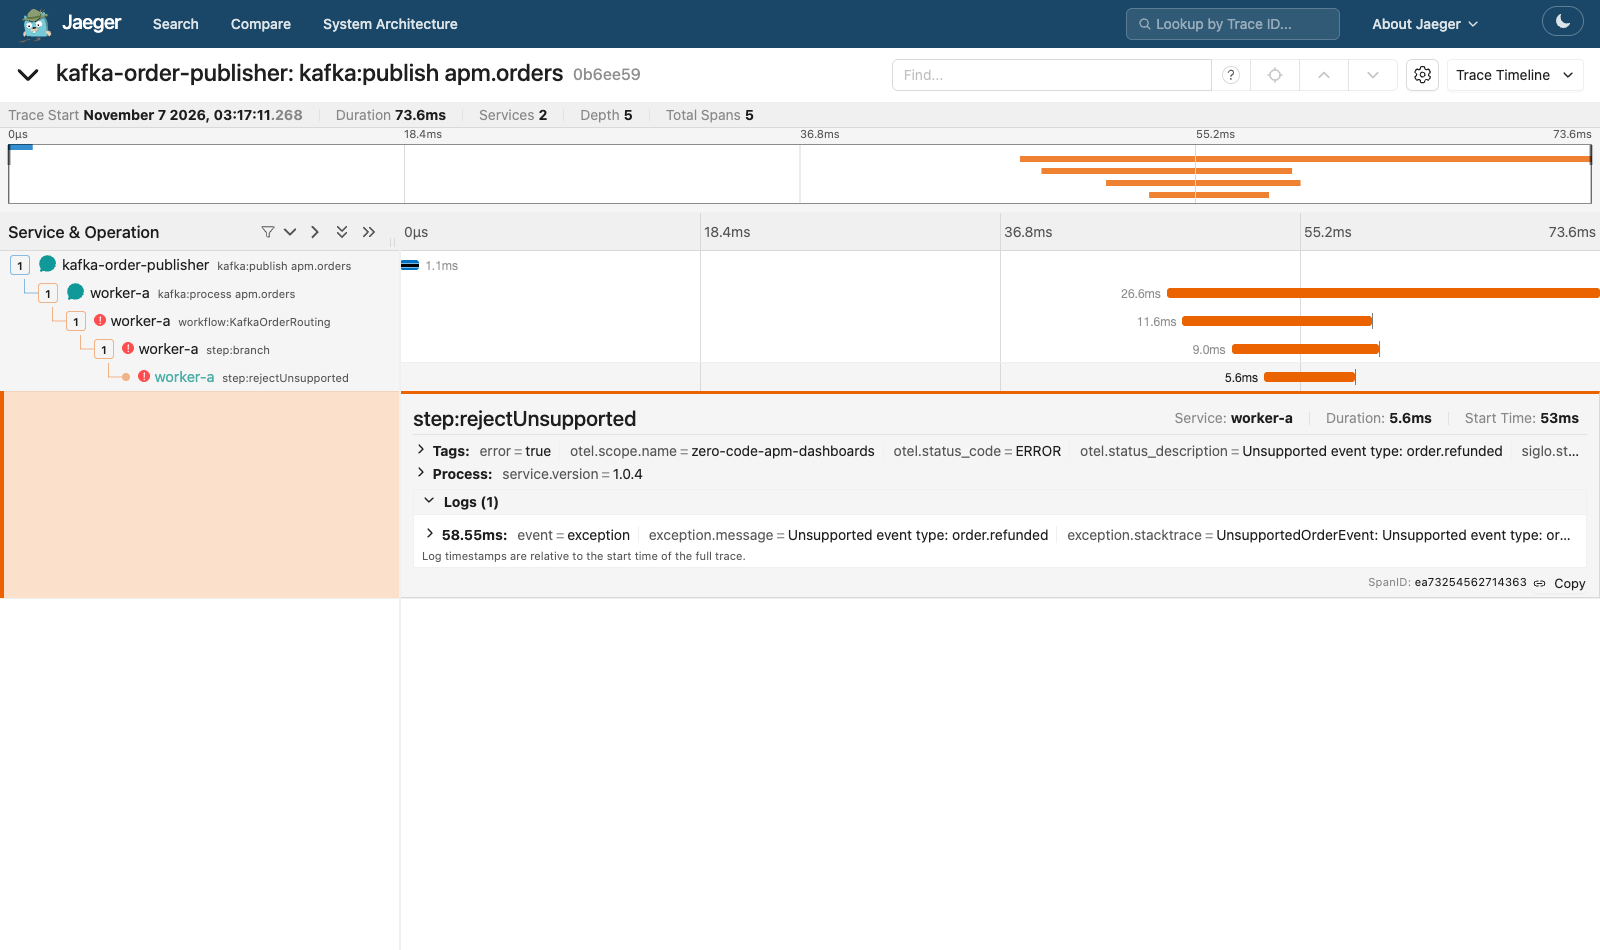
workflow:KafkaOrderRouting and step:rejectUnsupported have error status. Inspect the exception event for Unsupported event type: order.refunded. The outer consumer span can still be OK: the adapter successfully quarantined the record and returned normally. That means record handling finished, not that fulfillment succeeded.
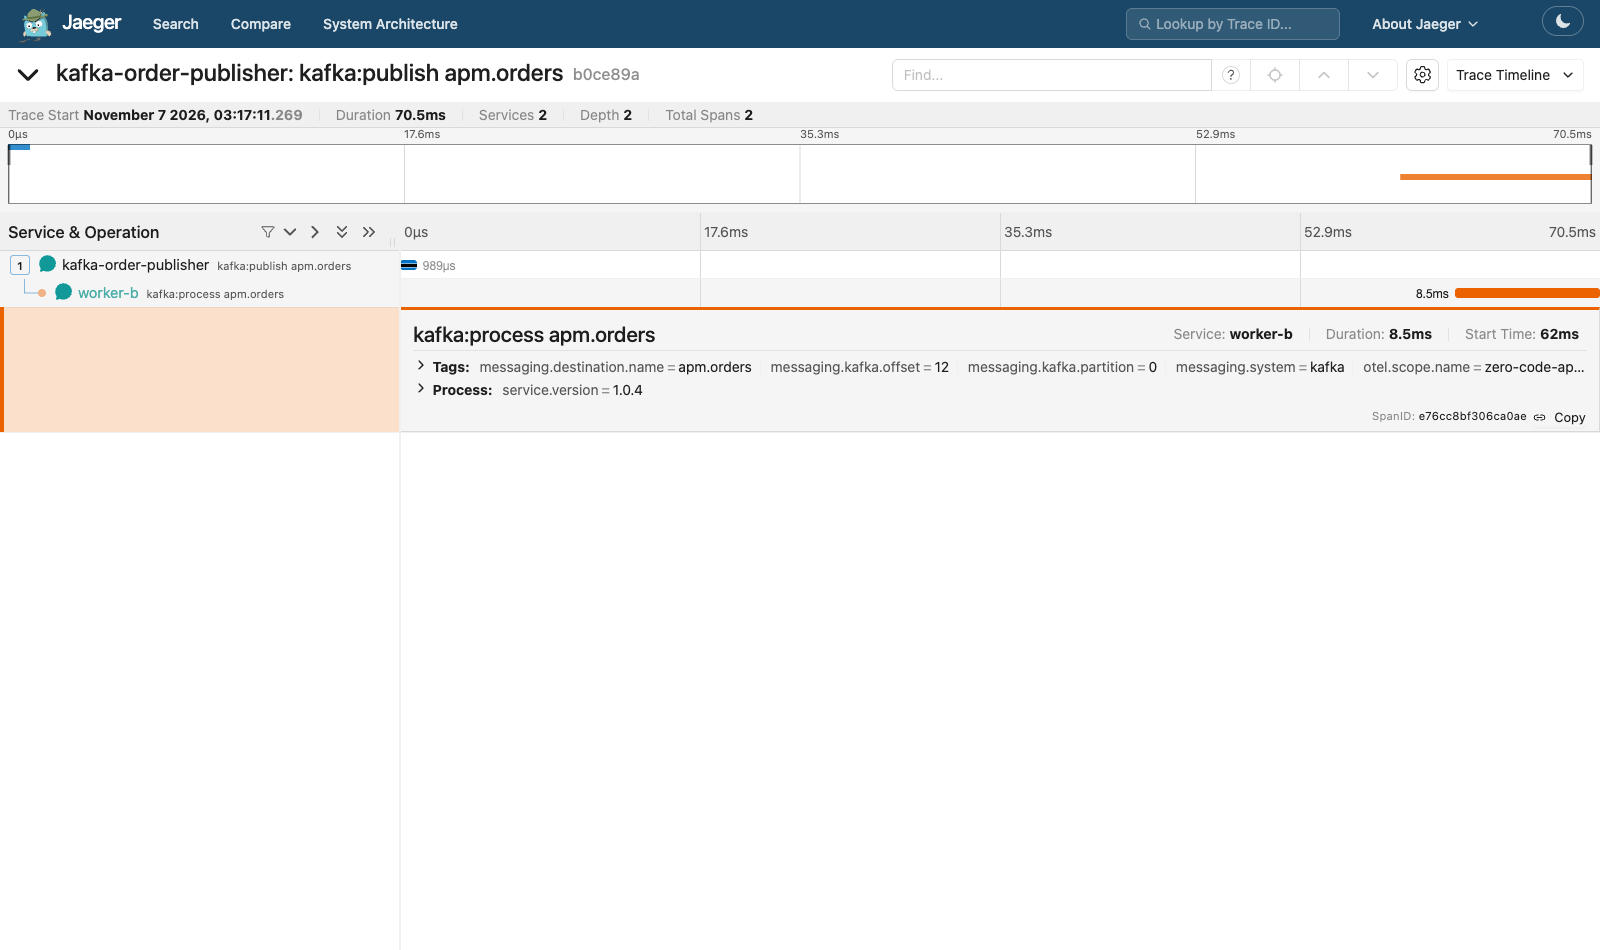
For invalid, expect producer and consumer spans, but no workflow or business-step spans. The metrics for executed workflows do not count malformed input rejected before execution. Check /dead-letters or the real dead-letter topic for the rejected record; see the Kafka tutorial’s dead-letter walkthrough.
Review is a completed decision, not a suspended workflow. Cancellation records a request; it does not refund a previous payment.
Standard: Worker A Ships Without Gift Wrapping
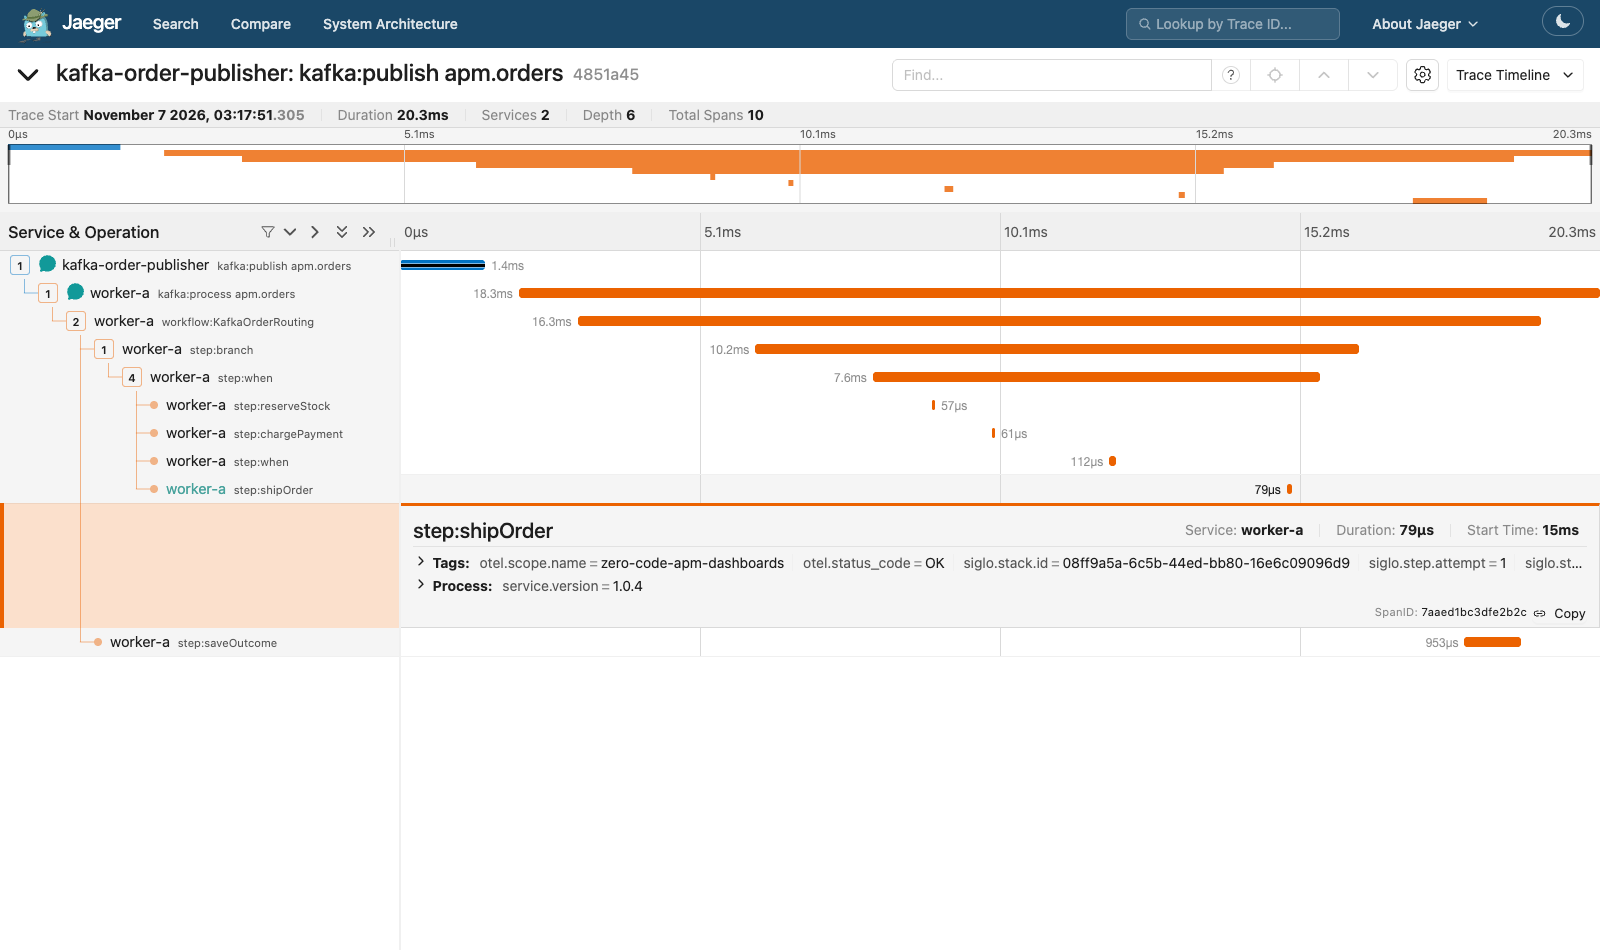
This captured event was consumed by worker-a. Its trace continues fromkafka-order-publisher into kafka:process apm.orders, the workflow, and the selected fulfillment actions. shipOrder is expanded; wrapGift is absent.
Gift: Worker B Takes the Optional Step
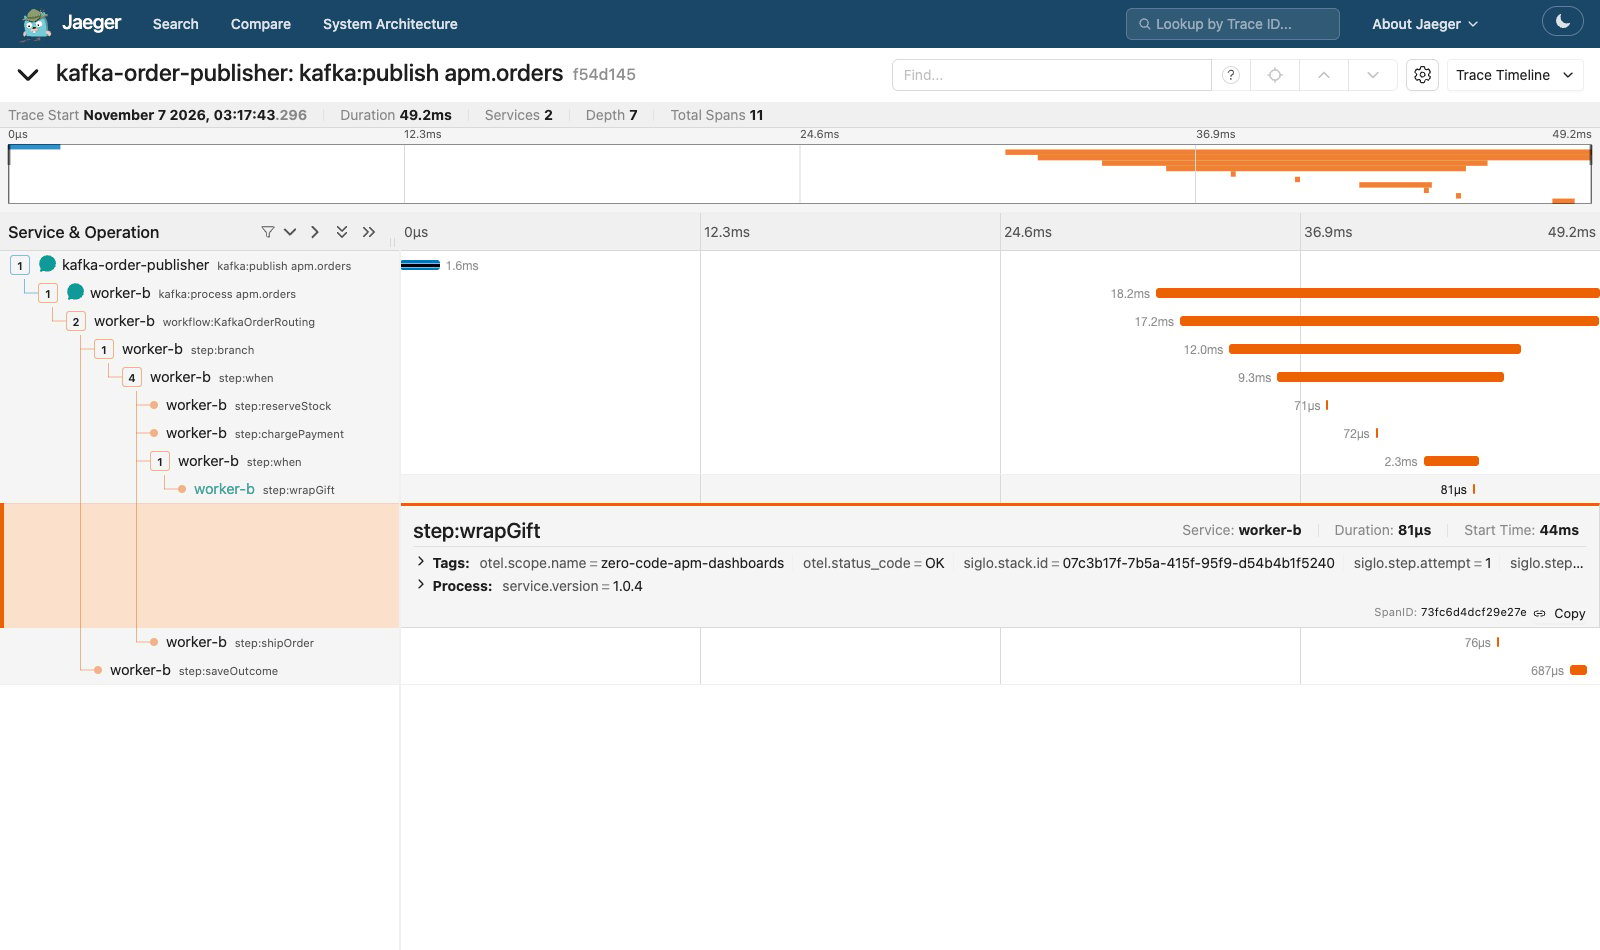
This event was consumed by worker-b.wrapGift appears between payment and shipping, and its expanded details show the worker service and attempt number. Compare the service labels with the standard-order screenshot: separate records can run on different replicas while each retains its own producer-to-consumer trace.
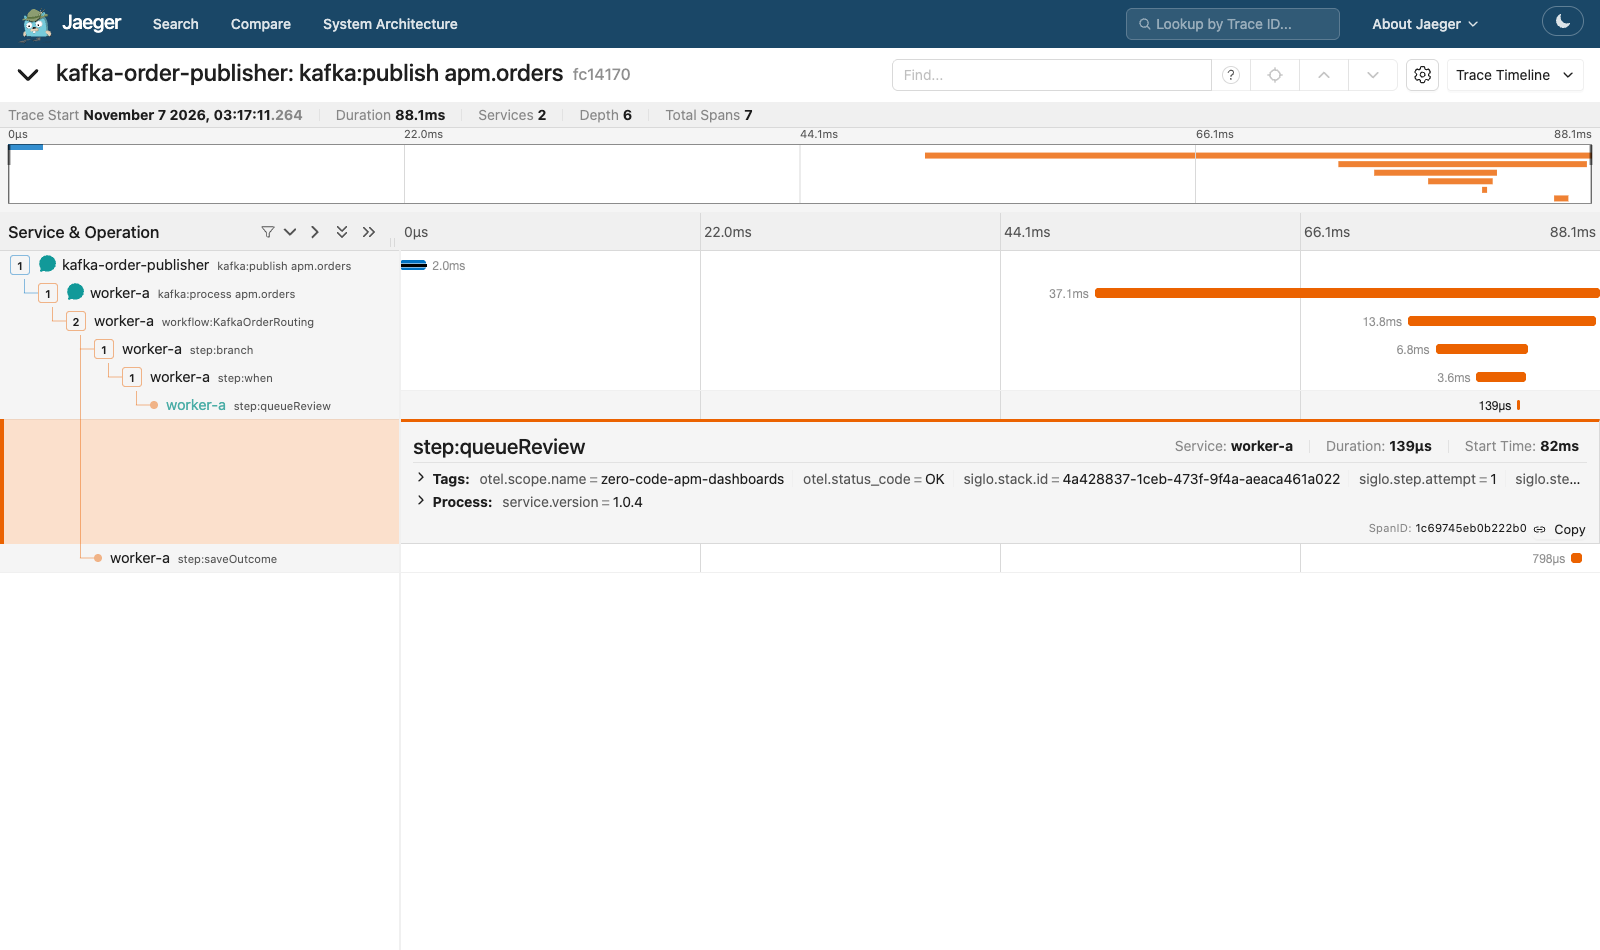
Review: Complete the Review Decision
The selected path runsqueueReview and saveOutcome. Payment and shipping spans are absent. This workflow completes its review decision; it does not wait for approval.
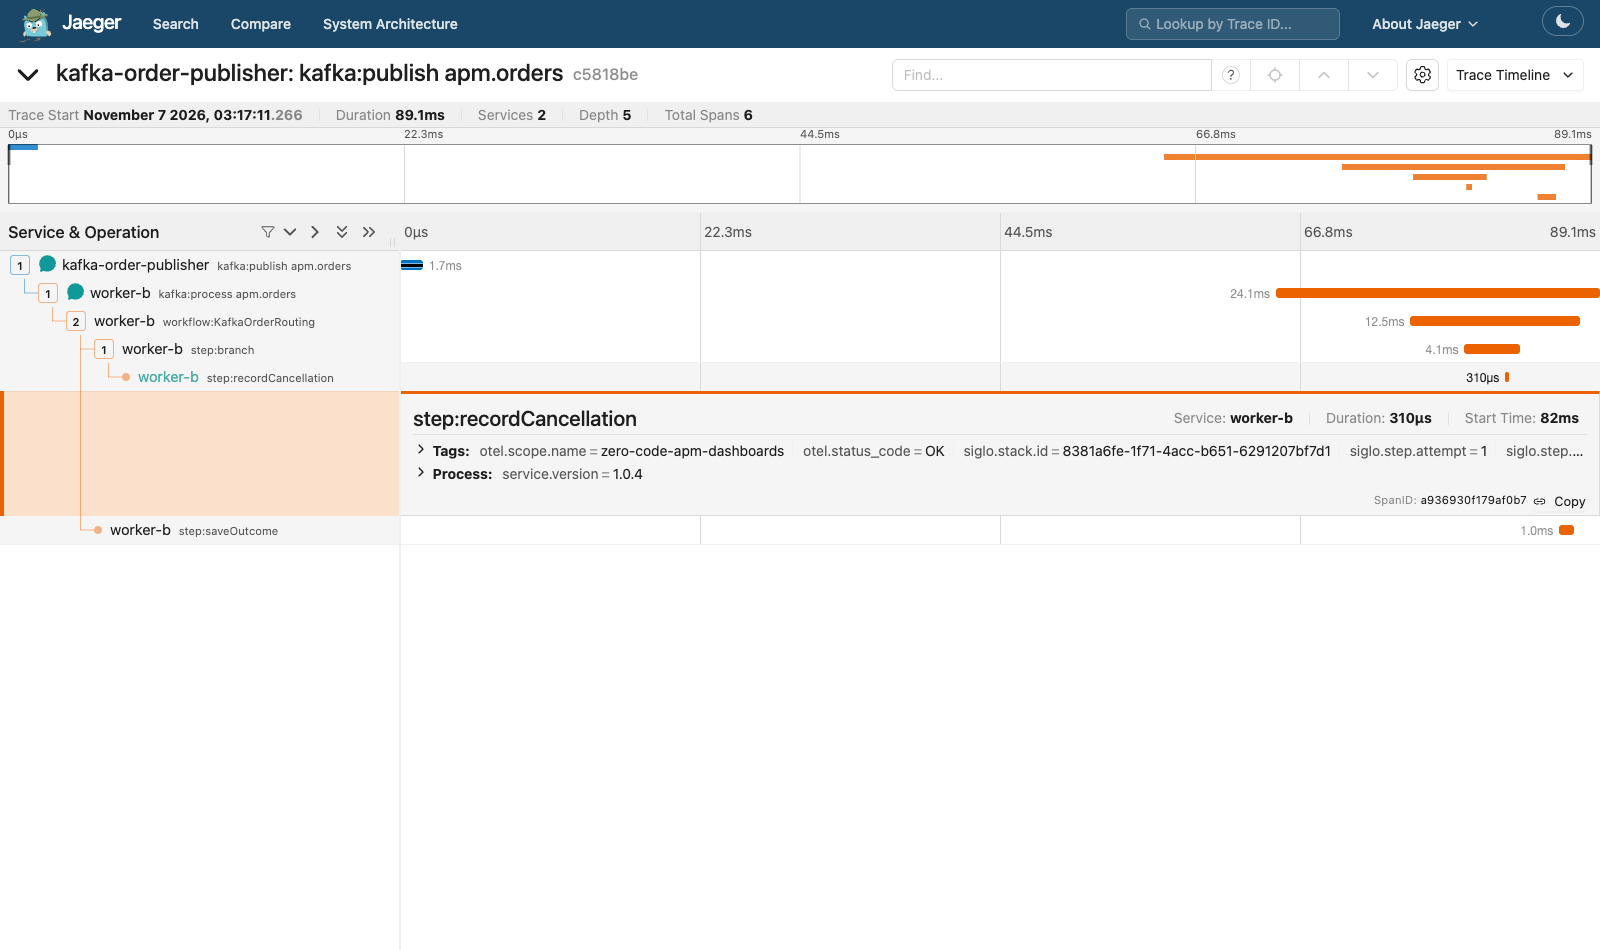
Cancellation: Select the Cancellation Branch
The record goes throughrecordCancellation and then persists its result. Its trace contains no inventory, payment, gift-wrapping, or shipping actions.
Unsupported: Inspect the Workflow Error
The red error indicators identify the failed workflow, branch, andrejectUnsupported action. The expanded span shows otel.status_code = ERROR and the exception message Unsupported event type: order.refunded. The outer consumer span succeeds after the adapter publishes the dead letter.
Invalid JSON: Handling Without a Workflow
Only the publisher and consumer spans exist: Total Spans 2. The consumer’s expanded details show the Kafka partition and offset. There is noworkflow:KafkaOrderRouting child because parsing failed first. Check /dead-letters for the rejection; an OK consumer span means quarantine completed, not that the input was valid.
5. Read the Grafana Metrics
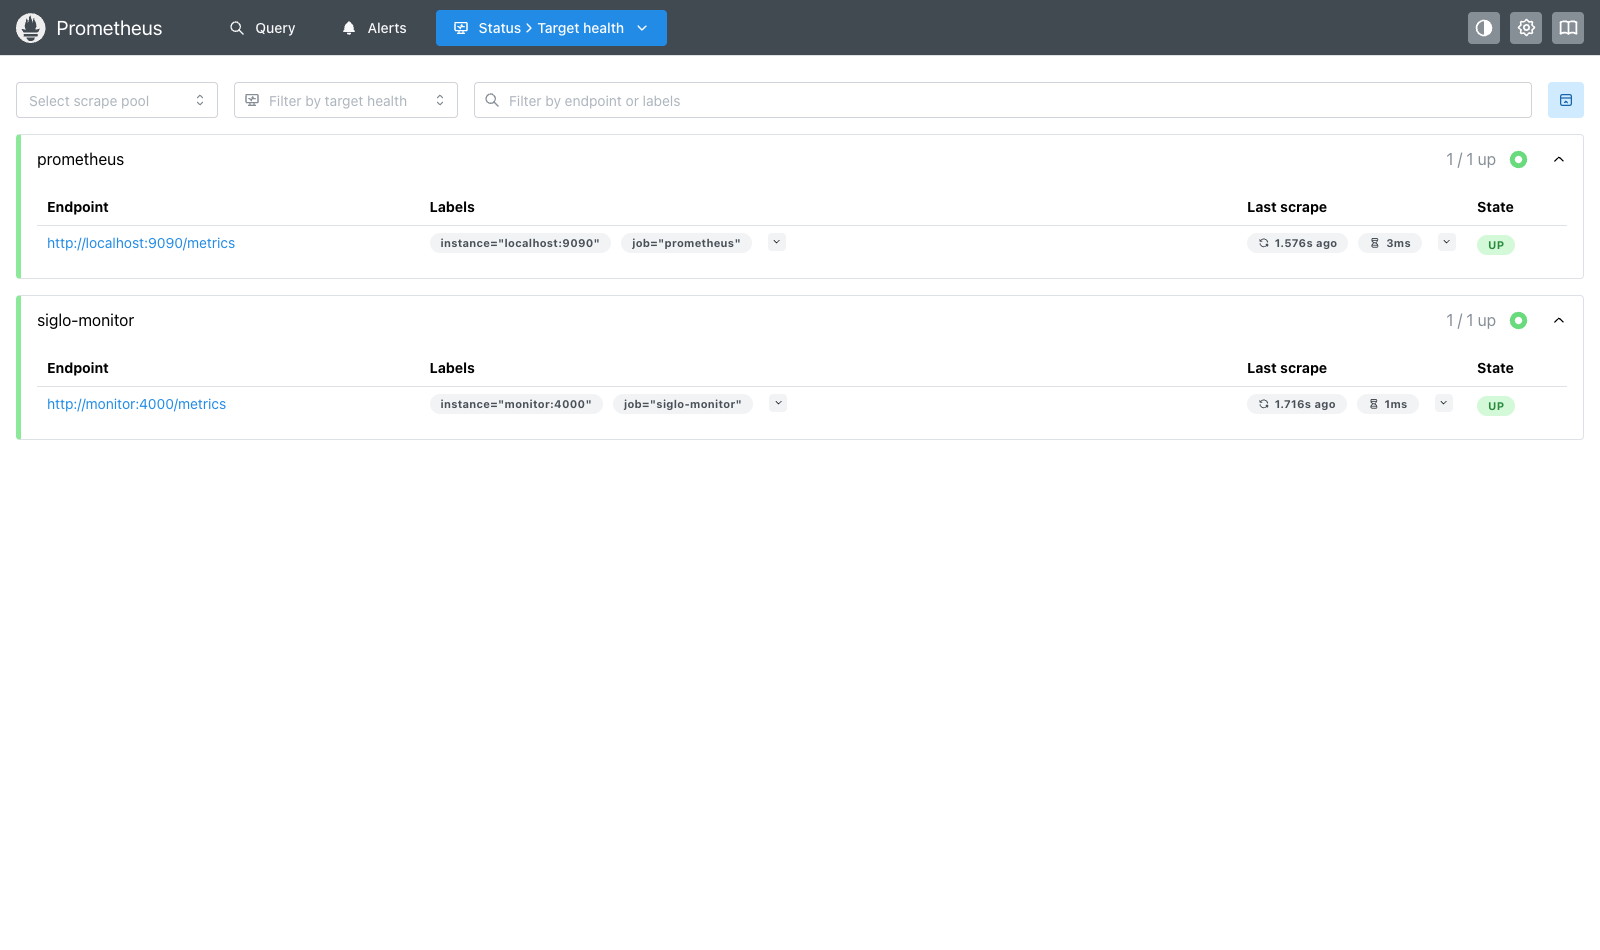
The dedicated stack usesprometheus.kafka.yml to scrape monitor:4000/metrics inside Docker. Port 4400 is its host mapping. The original routing tutorial’s monitor on port 4300 is not part of this scrape configuration.
Prometheus scrapes every five seconds. After publishing, wait about 15 seconds for counters to appear. Publish fresh events over at least a minute to make the rate charts useful.
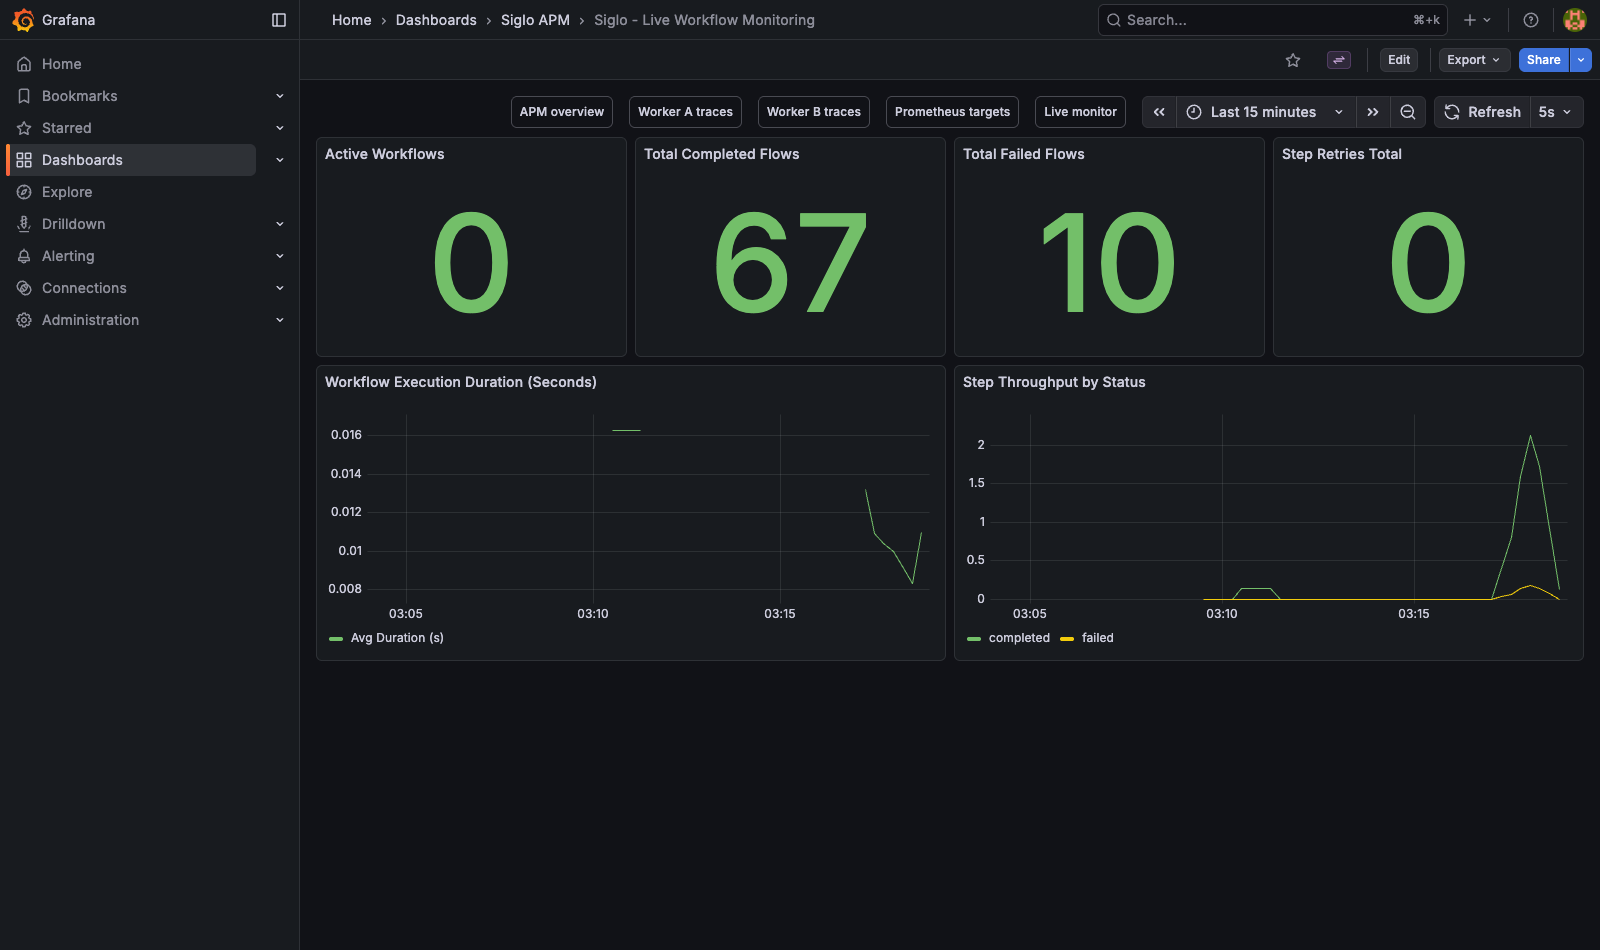
Open Siglo - Live Workflow Monitoring directly, or click Workflow metrics at the top of the overview. The screenshot shows completed and failed workflow counters above the duration and throughput charts. Active Workflows = 0 and Step Retries Total = 0 are expected between these short, non-retrying runs.
http://monitor:4000/metrics inside Docker; the browser-facing equivalent is 127.0.0.1:4400/metrics.
kafka-order-publisher, worker-a, or worker-b.
Siglo - Live Workflow Monitoring shows active flows, completions, failures, step retries, average duration, and step throughput. Interpret its panels with the runtime’s scope in mind:
- Nested flows can emit their own lifecycle events. Aggregate workflow counters count those executions too; they are not a Kafka record counter.
- Invalid JSON never starts a workflow. A failed unsupported-event workflow still counts as failed after its record reaches the dead-letter topic.
siglo_step_retries_totalcounts Siglo step retries, not Kafka redeliveries or adapter-level workflow retries. The normal routing scenarios do not retry steps, so zero is expected.- Active workflows may read zero between scrapes because the fake operations finish quickly.
- Average duration uses
rate(siglo_flow_duration_seconds_sum[...]) / rate(siglo_flow_duration_seconds_count[...]). It is an aggregate average, not a percentile or a per-worker breakdown. - Counters reset when the shared monitor restarts. Redis Pub/Sub does not replay historical events. Grafana’s time selector does not turn a cumulative counter into a count for that interval.
- SCRAPE UP confirms that Prometheus can scrape the monitor; it doesn’t prove traces reached Jaeger.
up{job="siglo-monitor"}, siglo_flows_total, and siglo_step_retries_total. Use Kafka-specific tooling for consumer lag and PostgreSQL results for persisted business outcomes; these dashboards do not supply those measures.
6. Observe a Deduplicated Event
Publish a standard order with explicit IDs:apm-replay-1001 appears in /results. Run exactly the same command again and inspect the second printed trace ID.
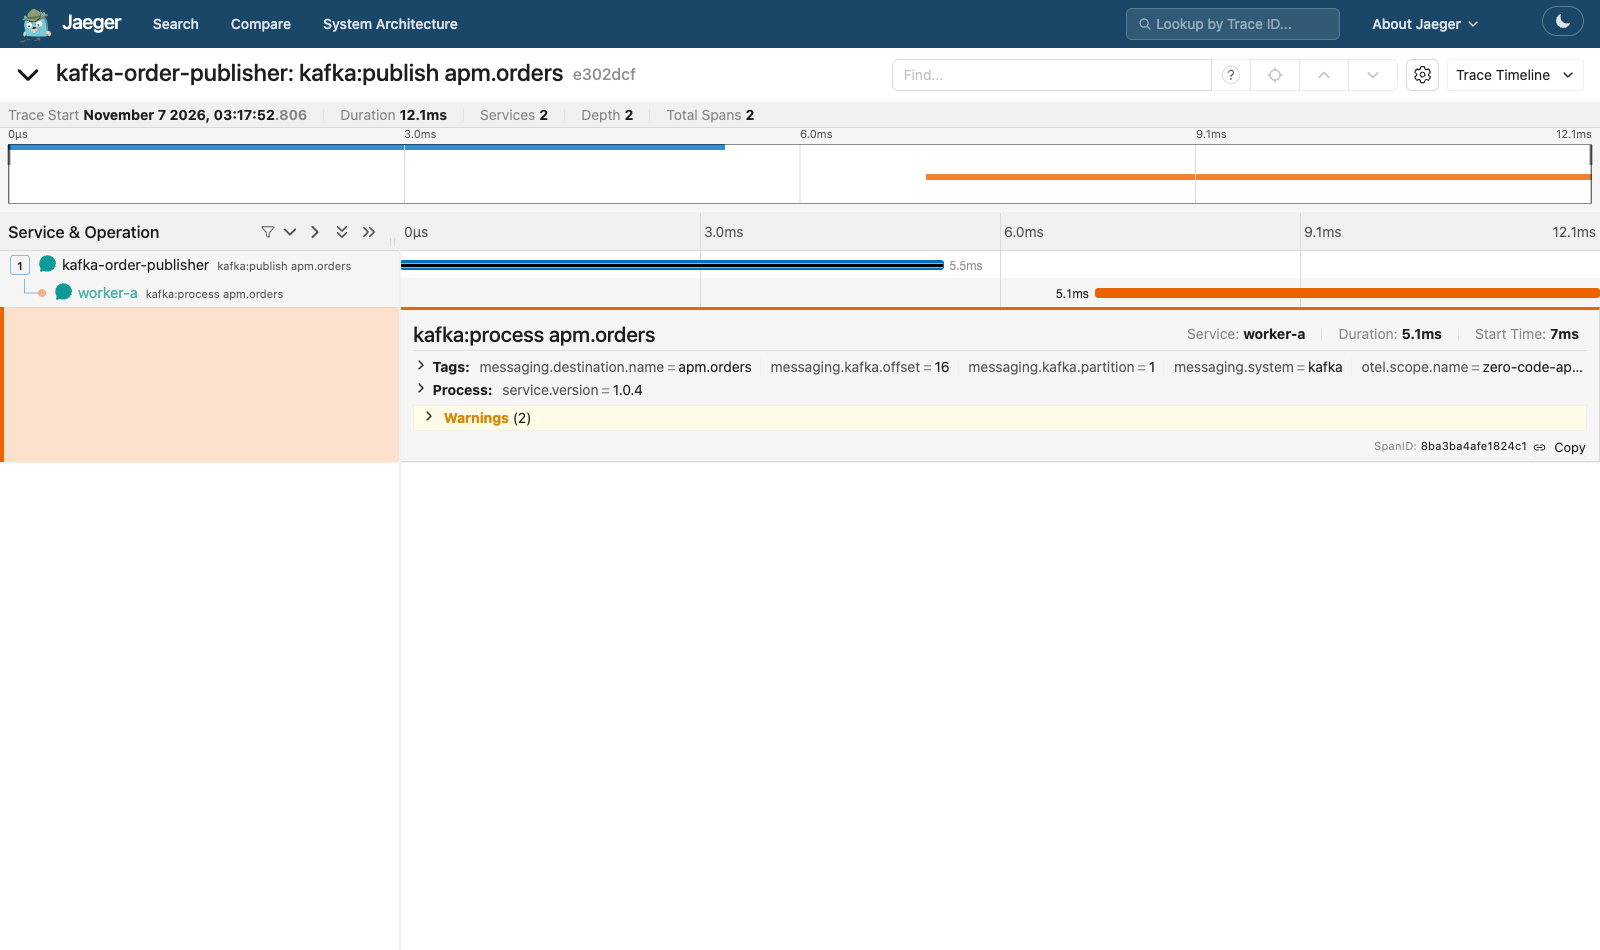
The second send has a new Kafka offset and a new producer trace. Its consumer span covers the adapter’s completed PostgreSQL claim lookup, but it has no workflow:KafkaOrderRouting child because the adapter returns the cached outcome. The persisted result’s executions stays at one, and no new workflow run appears in the live monitor.
The replay below has just the producer and consumer spans, with the consumer’s Kafka offset expanded. Compare it with the standard-order screenshot’s full workflow. Both invalid input and a completed duplicate can have two-span traces; use the dead-letter audit and persisted outcome to distinguish their meanings.
sh examples/zero-code-apm-dashboards/smoke.sh. It uses only this tutorial’s stack and its own smoke-test state file.
7. Inspect the Instrumentation
The CLI initializes a provider before sending.
publishScenario creates a producer span and injects its context into the Kafka headers. The worker extracts that context, starts a consumer span, and runs createKafkaMessageHandler inside it. instrumentWorkflow establishes execution hooks that automatically trace every executed step—including nested flows, branch, when, and concurrent operations—without requiring explicit child step instrumentation.
The worker enables telemetry when an OTLP endpoint is configured and export is not disabled with OTEL_TRACES_EXPORTER=none. This tutorial’s Compose file supplies the endpoint. The original Kafka routing tutorial has no APM wrapper or exporter. The exporter is created in its own Node.js async resource at SDK startup. This keeps background batch exports outside a business step’s inherited network policy without changing that step’s permissions. The worker shutdown path disconnects the consumer before flushing its telemetry provider. The HTTP /events publisher also uses tracing when enabled; its publish span belongs to the worker service, and the endpoint itself is not automatically HTTP-instrumented.
To use an external collector, configure OTEL_EXPORTER_OTLP_ENDPOINT and any OTEL_EXPORTER_OTLP_HEADERS on the publishing and consuming processes. A base endpoint gets /v1/traces appended; OTEL_EXPORTER_OTLP_TRACES_ENDPOINT supplies an exact trace URL and takes precedence. See OpenTelemetry exporter configuration. This example uses OTLP/HTTP JSON; choose a compatible receiver. Moving trace export does not move the Prometheus metrics.
8. Verify and Troubleshoot
After installing repository dependencies and building the core, Kafka, and OpenTelemetry packages, run the routing and tracing checks without Docker:
Inspect logs with this tutorial’s Compose file, replacing
up --build -d --wait with logs --tail=100 worker-a worker-b jaeger prometheus grafana.
Stop the example, including its APM services, with:
down; add --volumes only when intentionally resetting this APM example. The original routing example’s volumes are separate. The APM services use ephemeral storage, and the live monitor’s history is held in memory.