Siglo provides complete real-time live monitoring, dynamic DAG topology visualization, execution state diff inspection, and interactive DevTools for complex asynchronous workflows.
Unlike black-box execution engines, Siglo streams structured, strongly-typed execution events directly from the workflow engine without imposing runtime overhead or coupling your business logic to third-party proprietary services.
1. Architecture & Observability Layers
Observability is divided into four integrated layers:- Core Runtime & Event Bus (
@siglo/core): Zero-overheadWorkflowEventEmitter, asynchronous context propagation (stepInspectionStorage), durable wait state tracking (applyWaitEvent), and 18 strongly-typed execution events. - Ecosystem Diagnostics & Content Capture: Safe diagnostics and bounded, opt-in content capture (
InspectionCapturePolicy) across@siglo/http,@siglo/crypto,@siglo/notifications, and@siglo/ai. - Streaming Transports & React DevTools (
@siglo/monitor): Built-in Server-Sent Events (SSE), RFC 6455 WebSocket broadcaster, Redis pub/sub adapter, telemetry ingestion API (POST /api/events), and a self-contained React 18 + Vite + Tailwind CSS DevTools Single Page Application (SPA). - Developer & Production Telemetry: CLI Dev Server (
siglo monitor), Express/Fastify/Hono middlewares, Prometheus exposition (/metrics), and pre-packaged Grafana dashboard templates.
2. Standardized Execution Events
Workflows emit 18 typed lifecycle events during execution:Subscribing to Events Programmatically
UseWorkflowEventEmitter from @siglo/core:
3. Global Monitoring & Static Hooks
You can register a global default monitor for all workflows executed within an application process usingStep.setDefaultMonitor or the standalone setDefaultMonitor export:
4. Ecosystem Diagnostics & Safe Content Capture
Ecosystem steps (@siglo/http, @siglo/crypto, @siglo/notifications, @siglo/ai) automatically stream structured diagnostics into the monitoring pipeline using step:inspection and ai:complete events.
4.1 Four Diagnostic Categories
Diagnostics conform to versionedEcosystemInspection records:
- HTTP (
httpStep):- Captures HTTP method, safe origin-only URL (path and query strings omitted to protect tokens), status code, execution duration (
durationMs), request attempt, retry delay (retryDelayMs), retry delay source (retry-aftervs.backoff),Retry-Afterheader value in ms (retryAfterMs), retry count (retryAttempts), trace ID (traceId), and network policy compliance (policy:'allowed'|'denied'|'unknown'). - One-click Copy sanitized cURL button exports a valid, origin-only command (
curl --request POST --url 'https://api.stripe.com') omitting sensitive headers and payloads.
- Captures HTTP method, safe origin-only URL (path and query strings omitted to protect tokens), status code, execution duration (
- Crypto & Webhooks (
verifyWebhookStep):- Captures provider name, verification outcome category (
verified,rejected,invalid-payload,payload-too-large,missing-secret,unknown-provider,missing-signature,timestamp-rejected,replay-detected,invalid-signature), payload byte size, timestamp check (passed|failed|unavailable), and replay check.
- Captures provider name, verification outcome category (
- Notifications & Approvals (
sendNotificationStep):- Captures delivery channel (
email,slack,discord,sms,push), message ID (notificationId), delivery outcome, interactive approval state (requested,approved,rejected,forbidden,cancelled,expired,conflict,failed), action token status (issued|unavailable), and approval deadline (approvalExpiresAtin UTC).
- Captures delivery channel (
- AI & LLM Invocations (
aiStep):- Captures model provider, model name, prompt tokens, completion tokens, total tokens, estimated cost in USD, duration, phase (
attempt|completion|preflight), inference attempt count, repair attempts, and fallback counts.
- Captures model provider, model name, prompt tokens, completion tokens, total tokens, estimated cost in USD, duration, phase (
4.2 Opt-In Content Capture Policy
To inspect request/response payloads or notification previews without leaking credentials, configure anInspectionCapturePolicy on the step:
- Header Allowlisting: Only safe standard headers (
accept,content-type,content-length,cache-control,retry-after) are retained; all others are stripped. - Credential Stripping: Bearer tokens, Basic authorization strings, and URLs with embedded query parameters are replaced with
[Credential omitted]and[URL omitted]. - Ecosystem Content Suppression: When an ecosystem step executes, general workflow context changes and completion summaries for that step are suppressed to prevent credential leaks into context audit logs.
- Sandboxed HTML Previews: Email notification HTML previews render in an isolated
iframewith strict Content Security Policy (default-src 'none'; base-uri 'none'; form-action 'none') and inert formatting tag sanitization.
5. Durable Wait-State Inspection
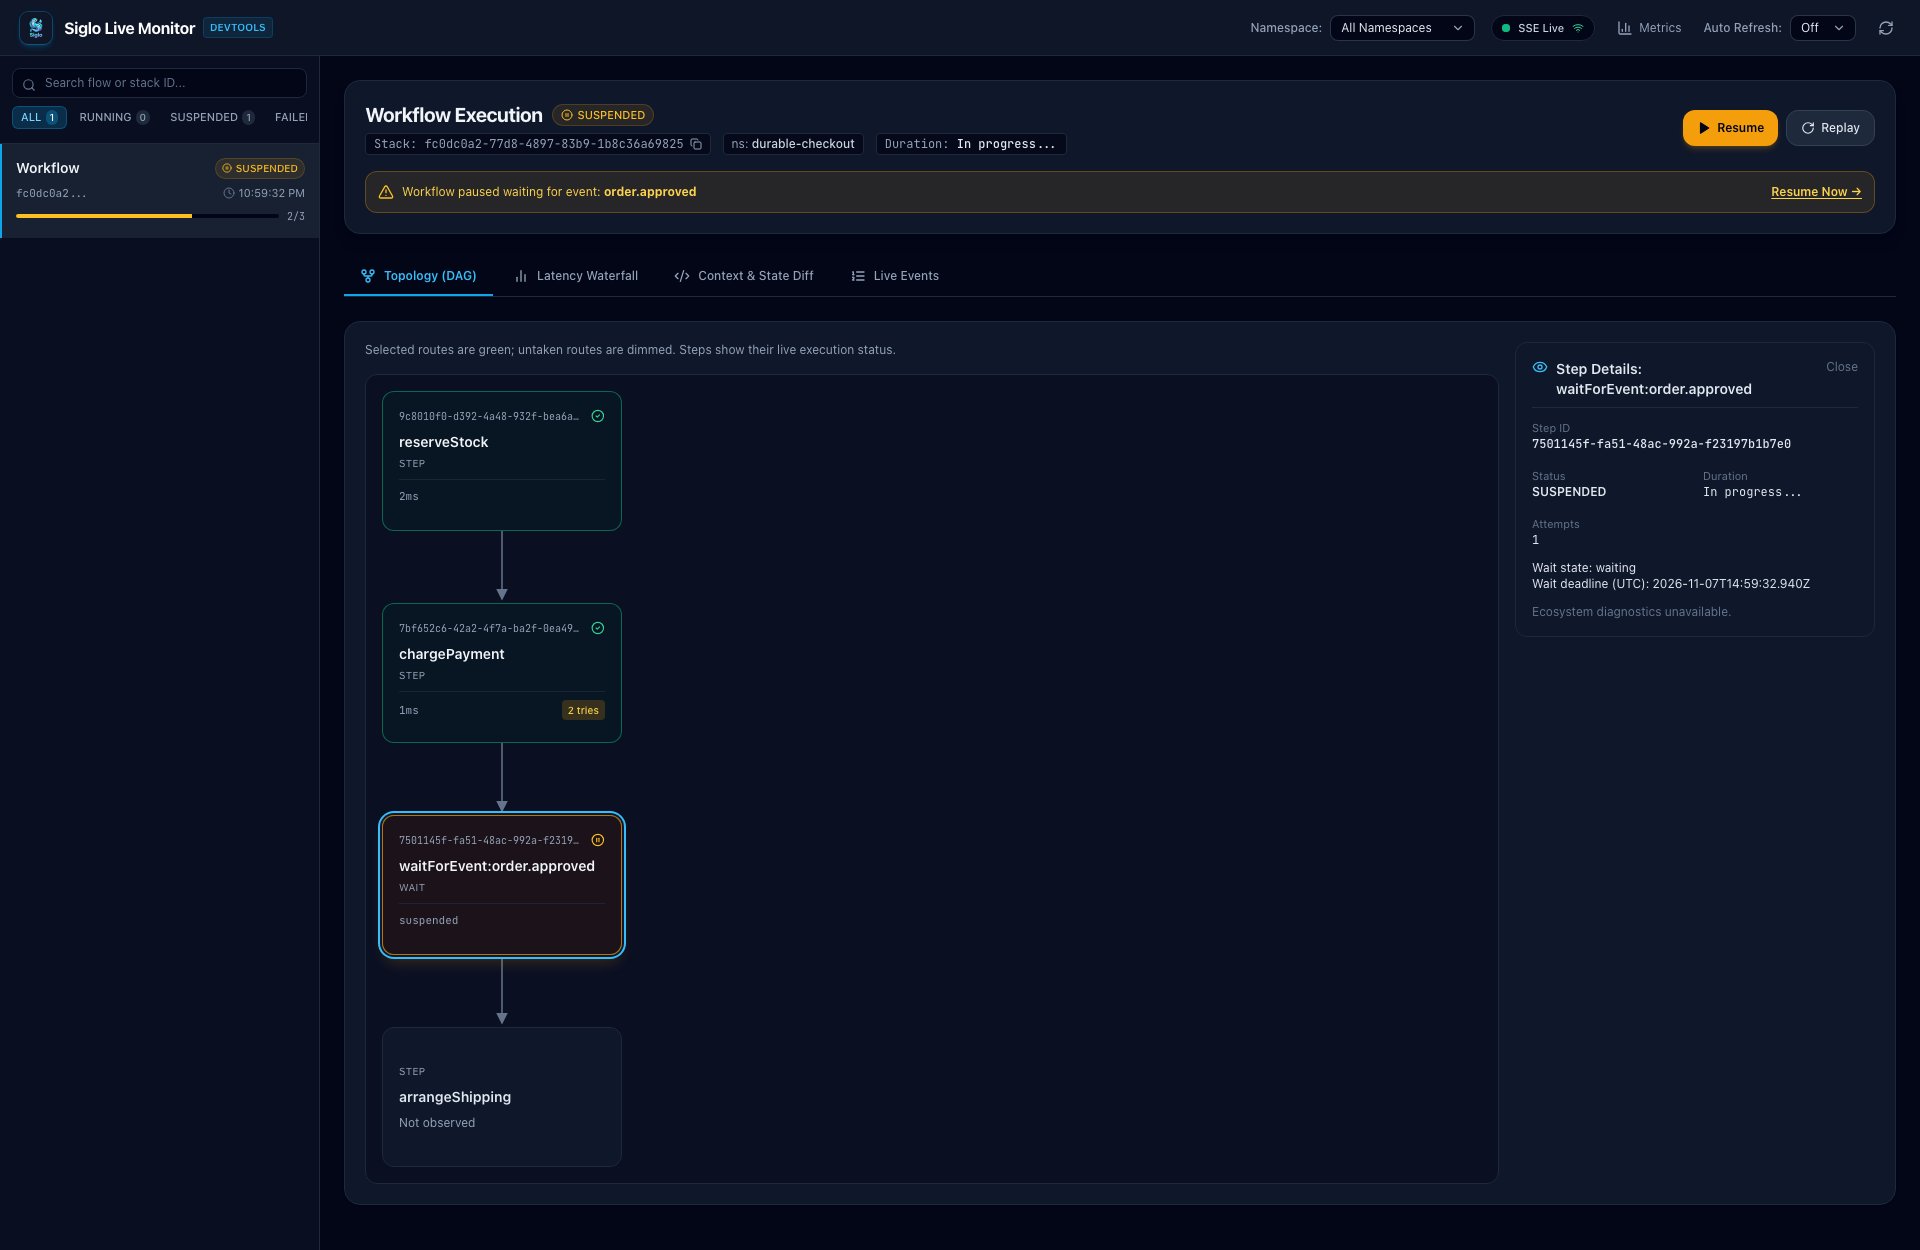
Workflows utilizingwaitForEvent() with optional timeouts have their wait lifecycles automatically tracked and surfaced in the monitor:
- Step Isolation: The
applyWaitEventlive reducer correlates wait state changes strictly bystepId. Concurrent or sibling wait steps in nested flows remain completely isolated. - Deadline Formatting: The monitor UI renders exact UTC deadlines (
waitExpiresAt), allowing operators to see when a suspended approval or SLA window will expire.
6. Real-Time DevTools Web Dashboard (@siglo/monitor)
Install @siglo/monitor:
Launching the Dashboard Server
Modern React 18 DevTools Features
The web dashboard is an interactive, zero-dependency Single Page Application (SPA) built with React 18, Vite, and Tailwind CSS. It embeds the Siglo brand logo and favicon, and delivers rich real-time tooling:-
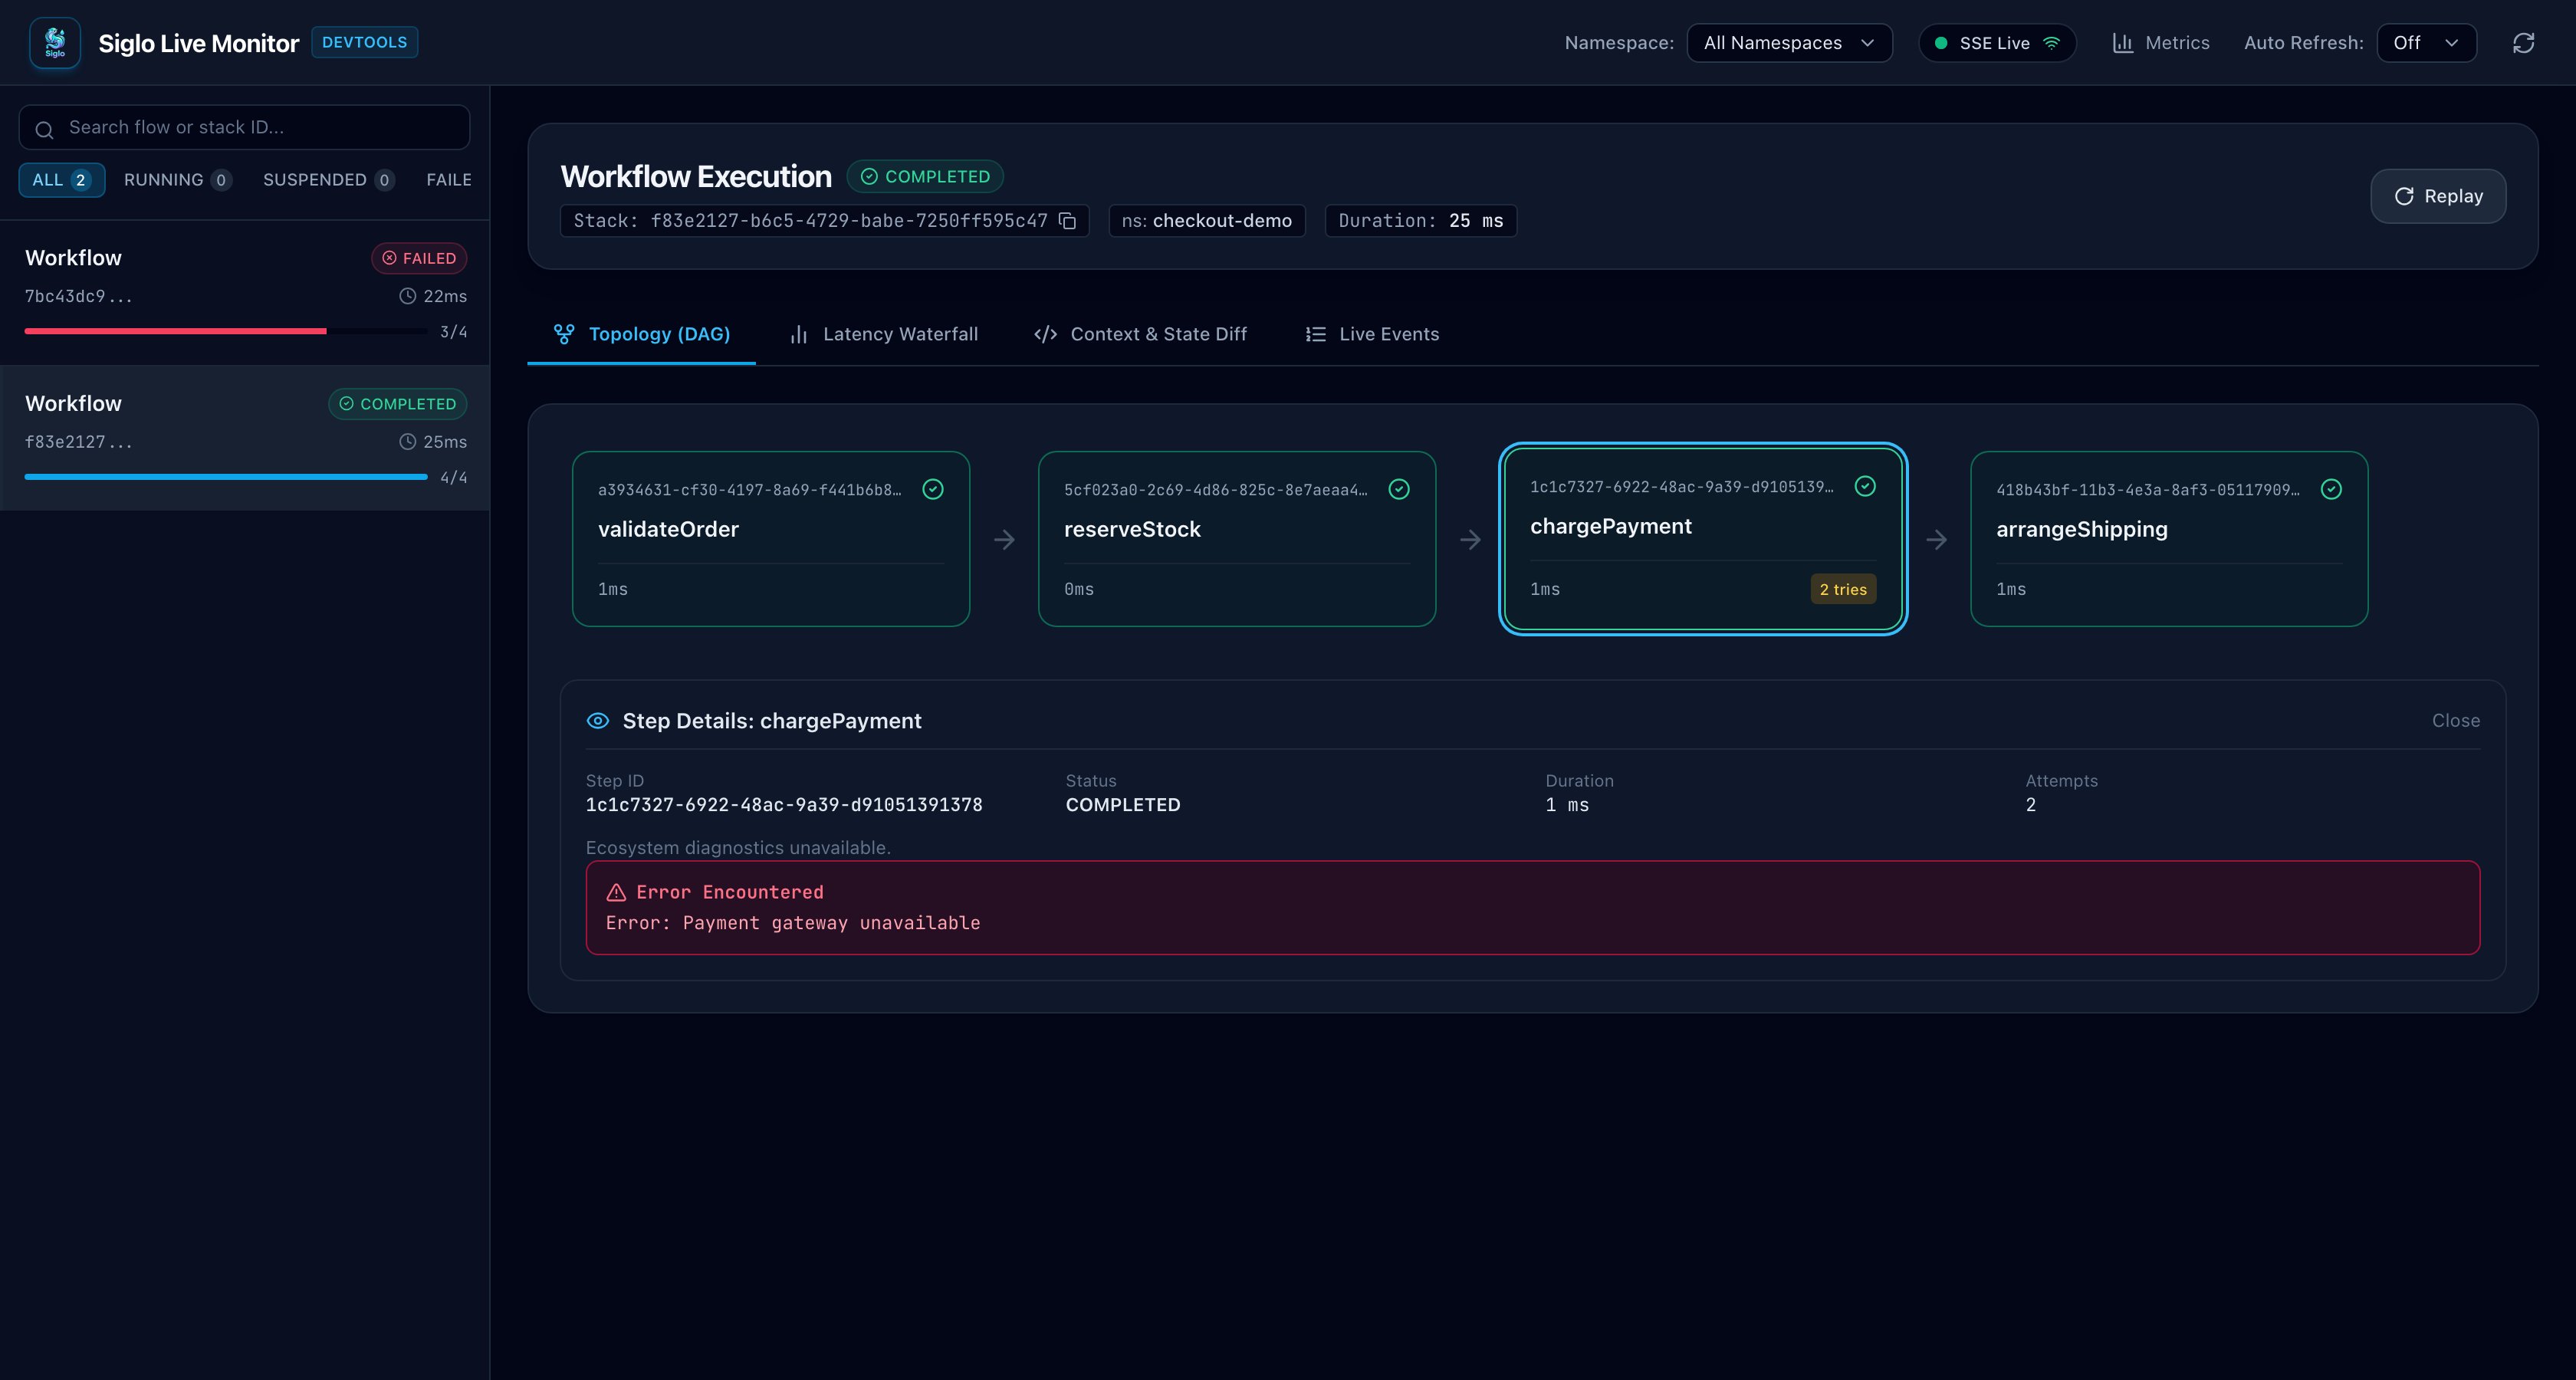
Interactive DAG Topology (
DagView):- Dynamic step cards rendering Step ID, Step Name, duration, attempt count (
# tries), and live status icons:- ⚪ Pending / Skipped (
Clockicon) - 🔵 Running / Retrying (animated rotating
RotateCwicon with sky glow) - 🟢 Completed (
CheckCircle2icon) - 🔴 Failed (
XCircleicon with rose border) - 🟡 Suspended / Waiting (
PauseCircleicon with amber border)
- ⚪ Pending / Skipped (
- Dynamic step cards rendering Step ID, Step Name, duration, attempt count (
-
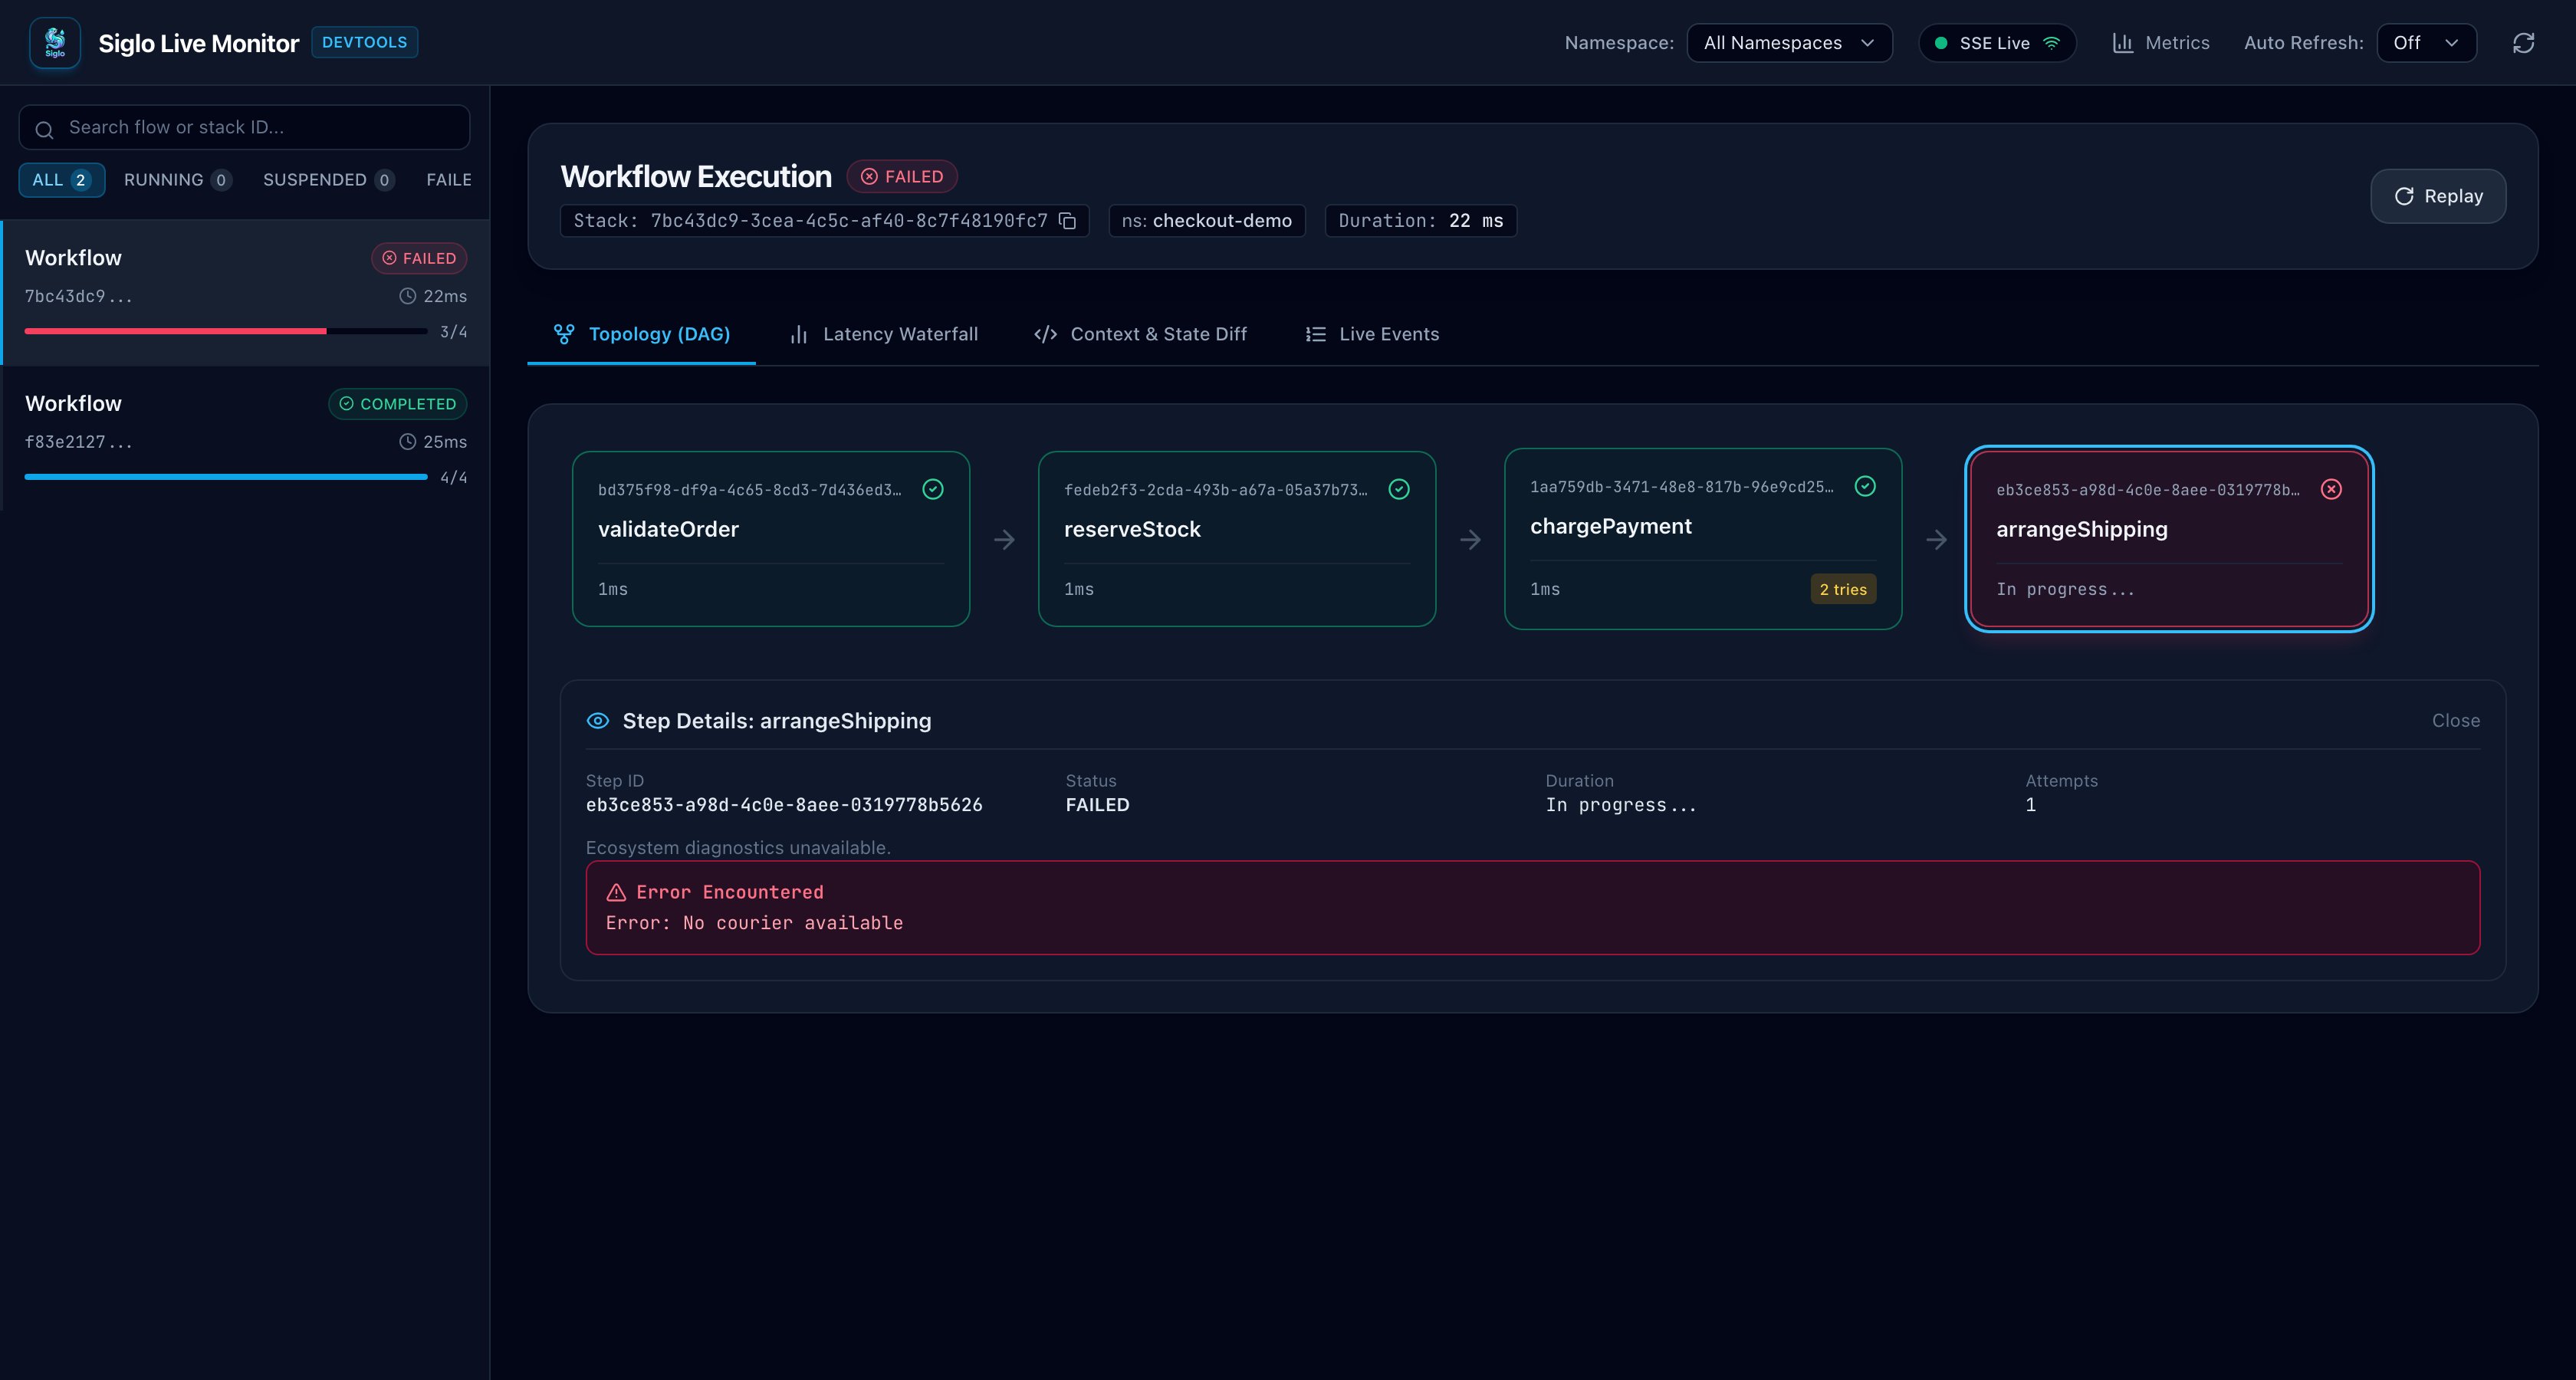
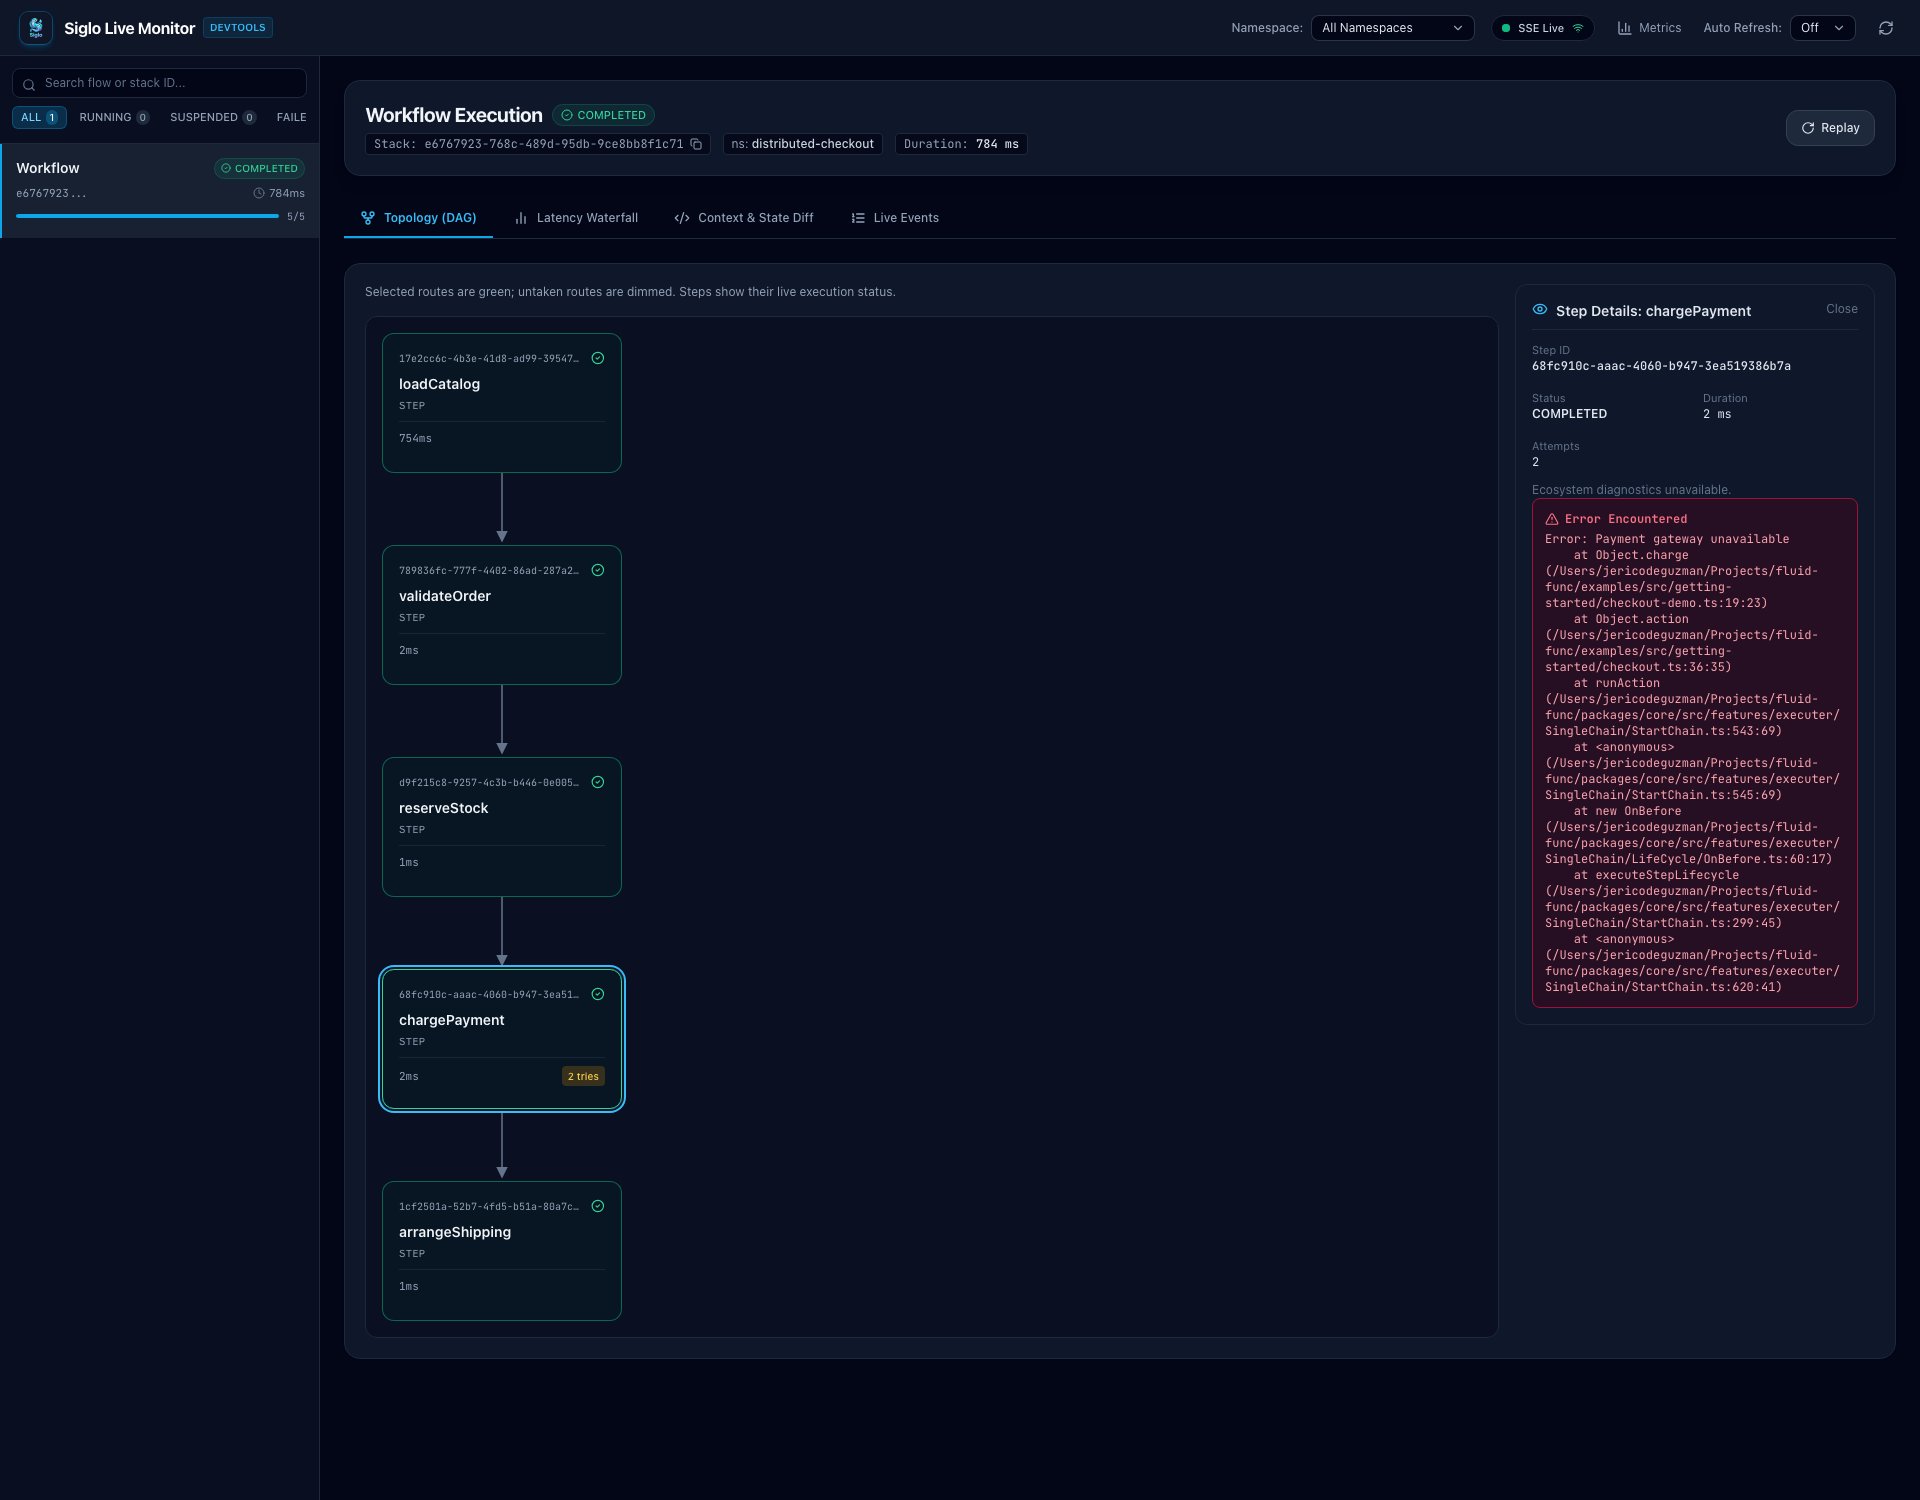
Step Detail Inspector (
StepDetailCard):- Clicking any step node opens a detailed inspection card.
- Shows Step ID, execution status, exact duration, and retry attempts.
- Wait-State Banner: Displays wait status (
waiting,resumed,expired) and formatted UTC deadline when applicable. - Ecosystem Diagnostics (
EcosystemInspector): Displays protocol-specific metadata (HTTP origins, status, retries, retry delay source, crypto verification, notification approval states, token counts, model cost in USD). - Sanitized cURL Export: One-click button to copy a safe, origin-only cURL command.
- Content Inspection & Sandboxed Previews: Expandable redacted request/response headers and bodies, with sandboxed iframe rendering for email notification previews.
- Error Details: Formatted error message and stack trace.
-
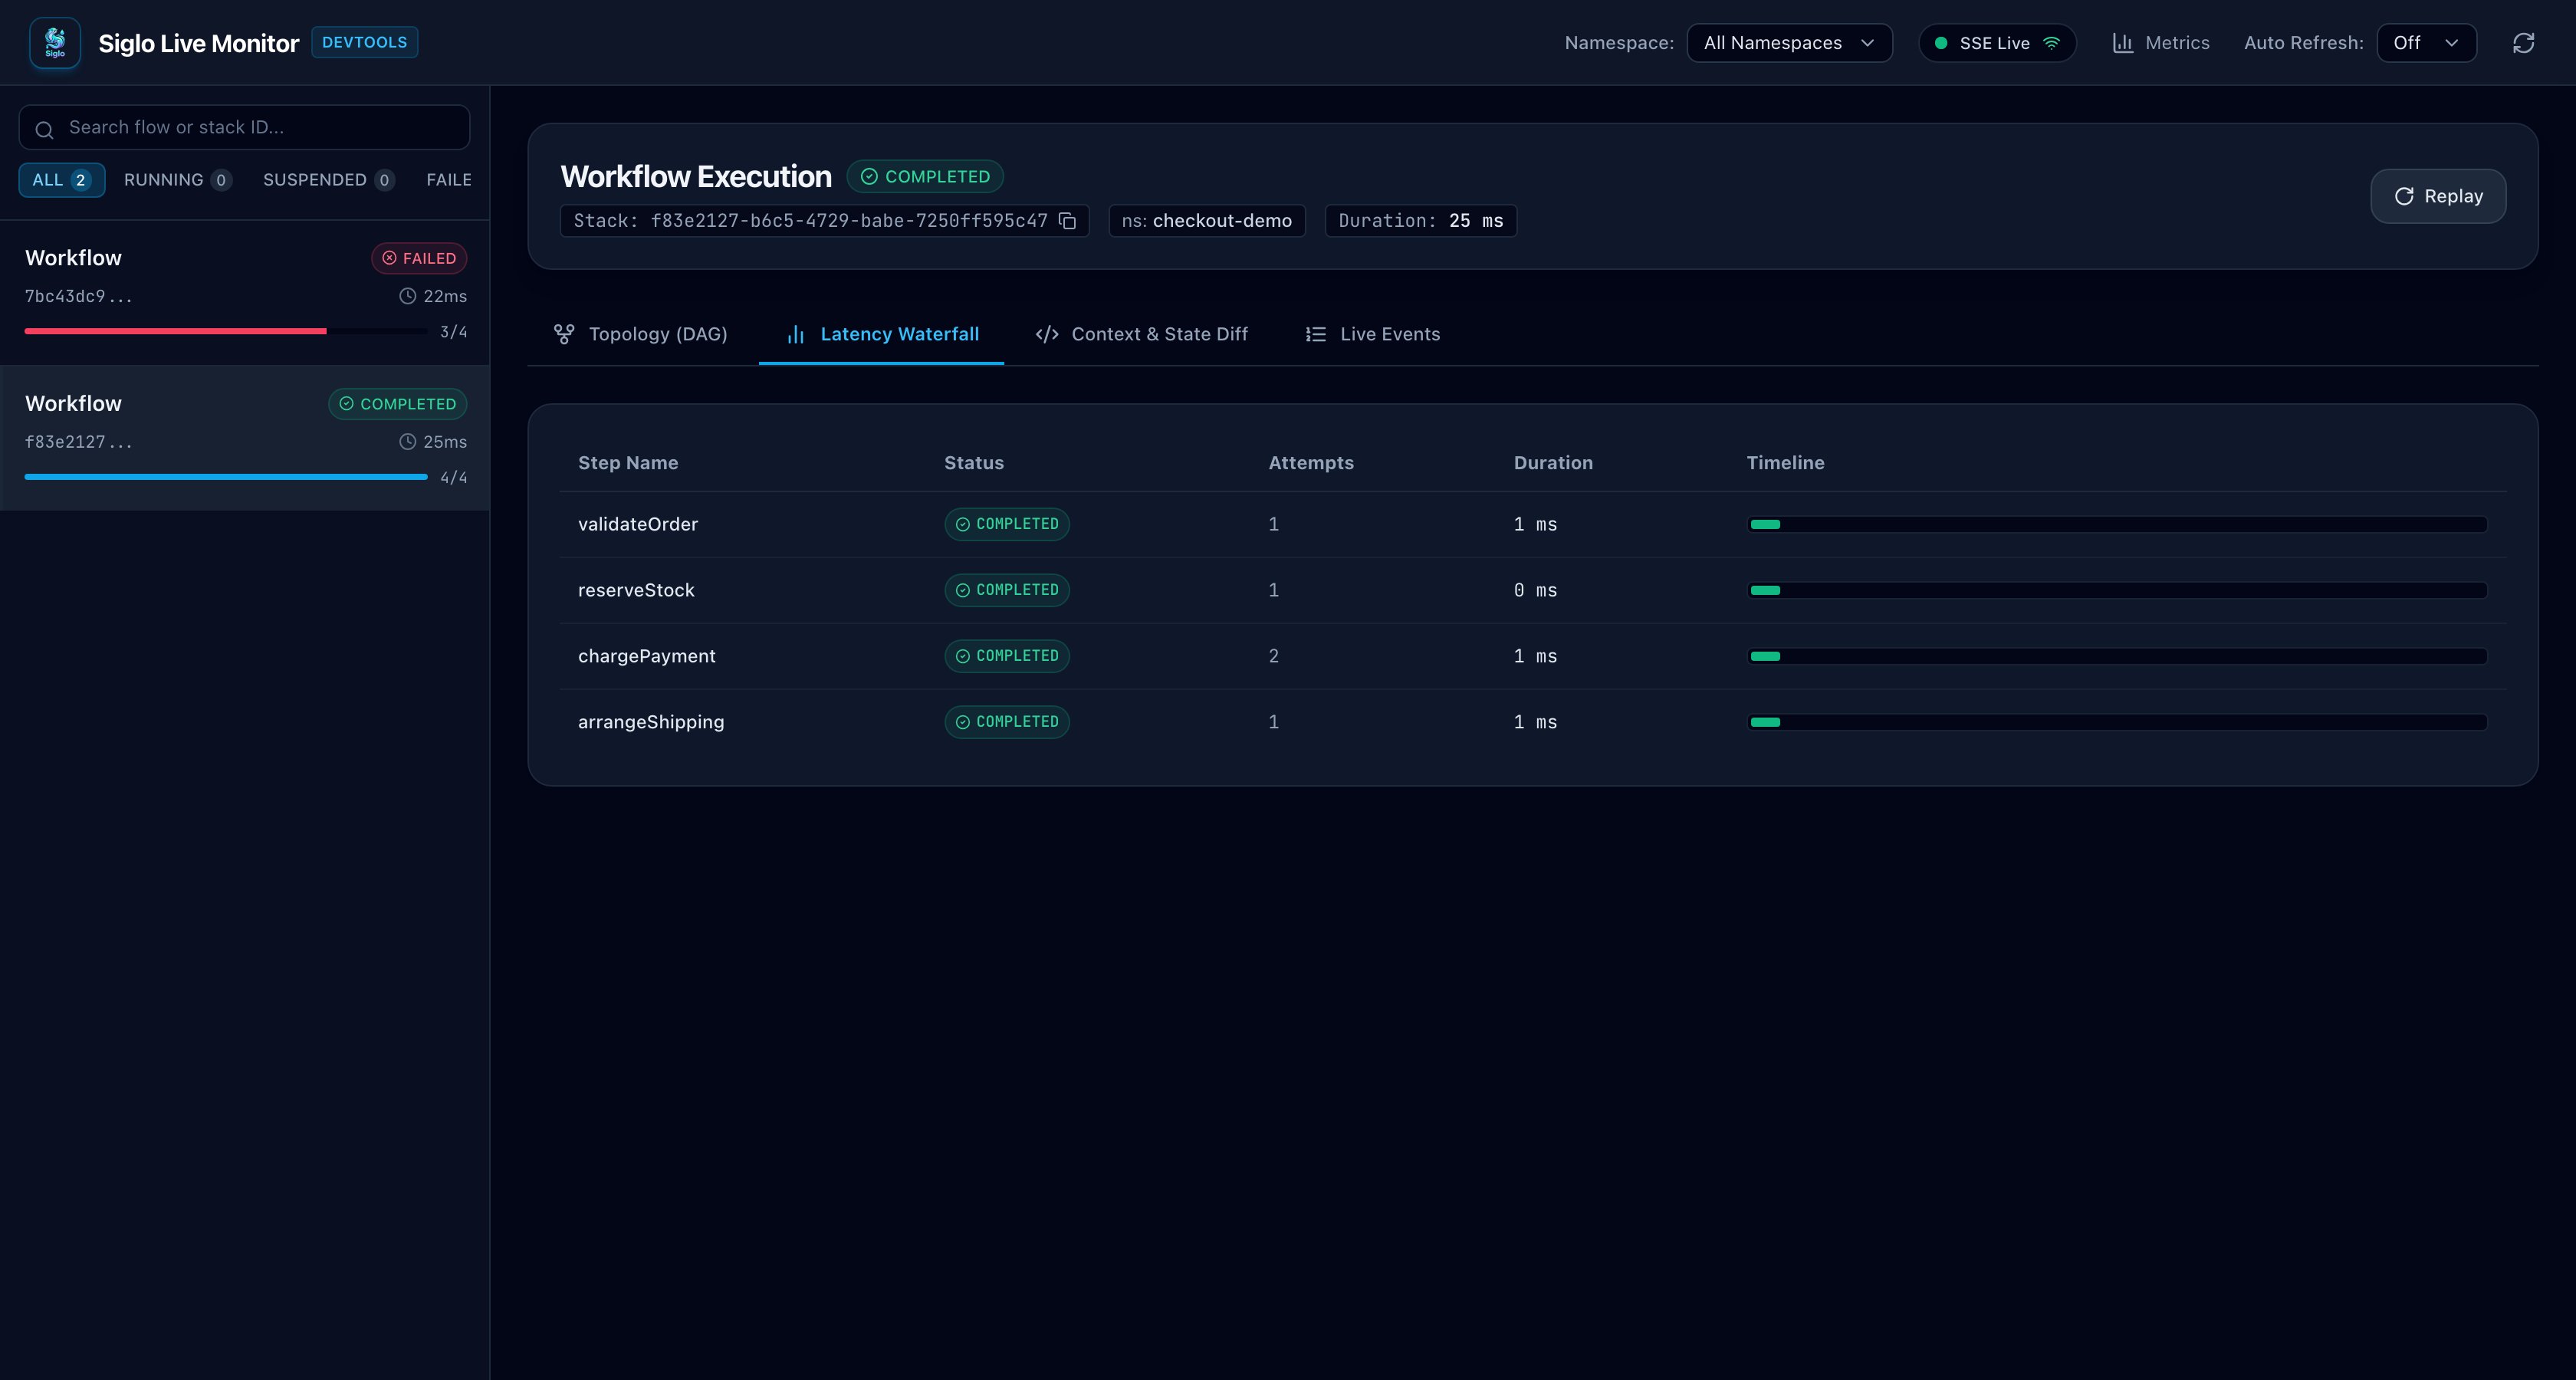
Step Latency Waterfall Timeline (
WaterfallView):- Tabular view listing step name, status badge, attempt count, duration in milliseconds, and proportional duration bar (
WaterfallBar). - Quickly identifies latency bottlenecks across serial and parallel steps.
- Tabular view listing step name, status badge, attempt count, duration in milliseconds, and proportional duration bar (
-
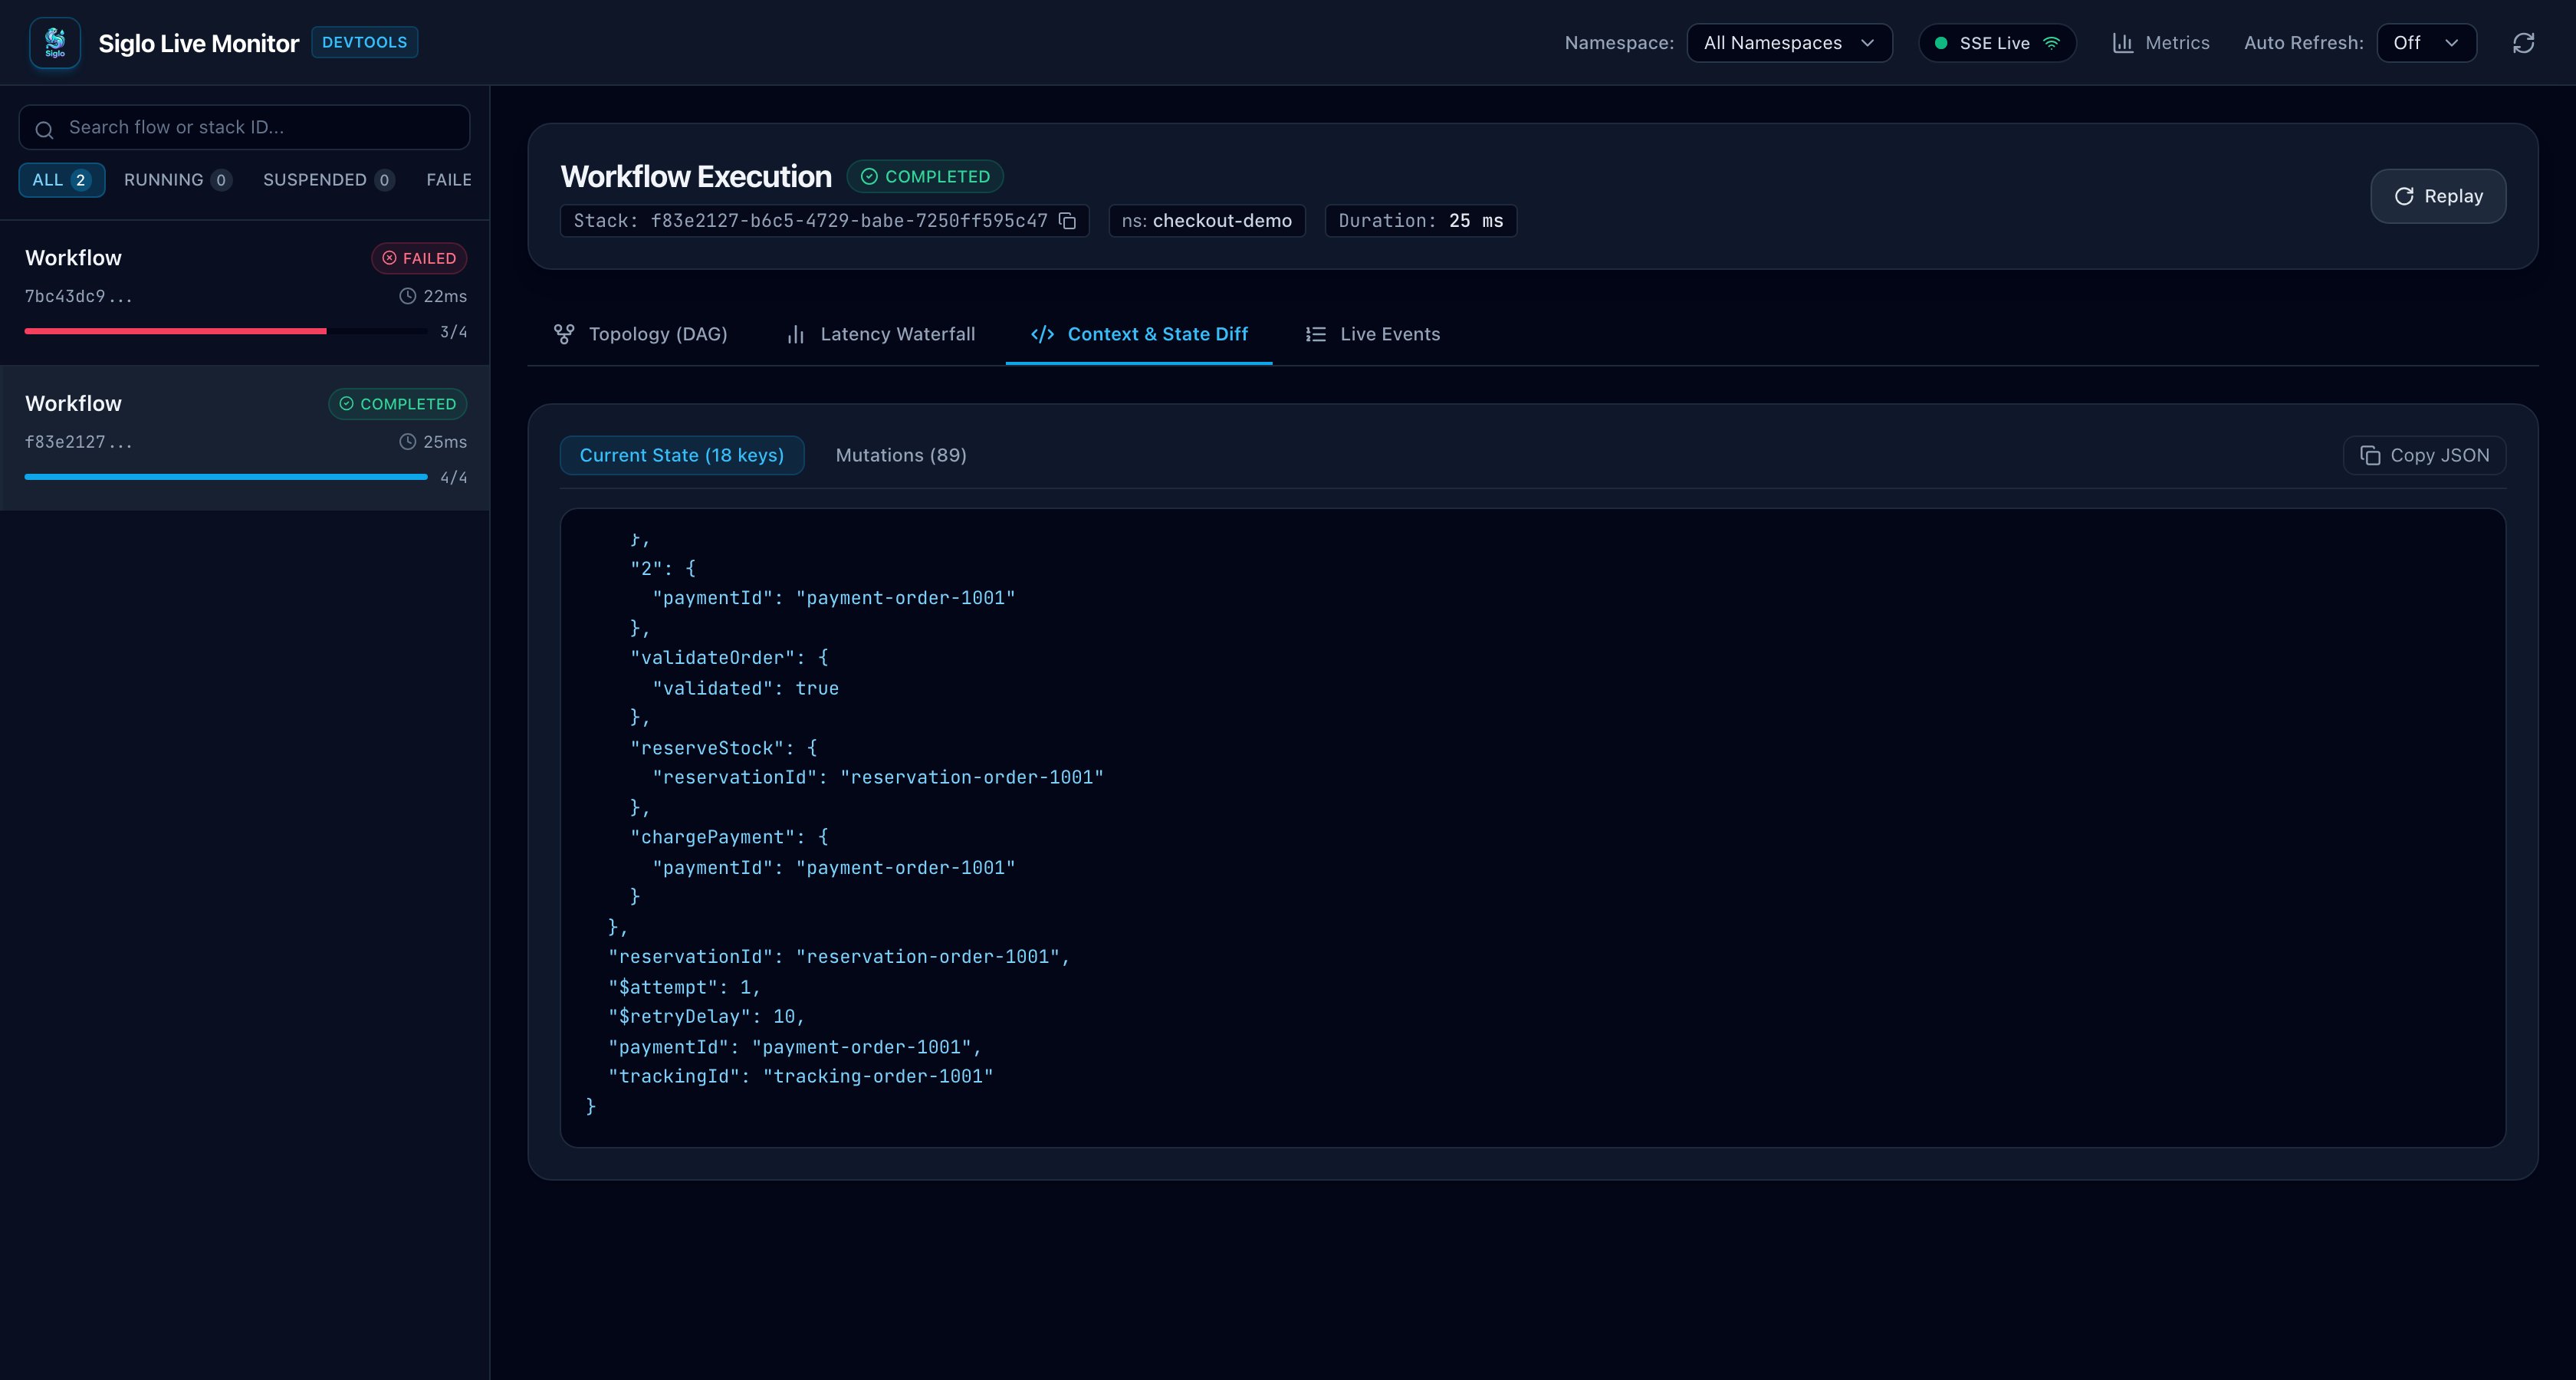
Context & State Diff Inspector (
ContextViewer):- Current State Tab: Monospace syntax-highlighted JSON viewer with one-click copy to clipboard.
- Mutations Tab: Chronological audit trail of granular field mutations (
context:change) with timestamps, keys, and values.
-
Live Events Feed (
EventsFeed):- Real-time event log streaming all 18 lifecycle events.
- Filter by event type (
ALL,step:start,step:complete,step:inspection,ai:complete, etc.). - Expandable raw event JSON viewer (
EventRow).
-
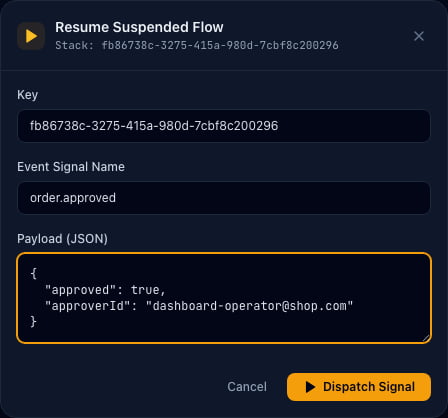
Interactive Durable Resumption (
ResumeModal):- Resumption modal for workflows suspended on
waitForEvent(). - Configure Stack ID / correlation key, event signal name, and custom JSON payload to unblock workflows directly from the browser.
- Resumption modal for workflows suspended on
-
Workflow Replay:
- One-click replay button (
POST /api/workflows/:stackId/replay) to re-trigger recorded workflow runs.
- One-click replay button (
-
Search, Metrics & Multi-Tenant Isolation:
- Search runs by flow name, stack ID, or namespace.
- Status filters:
ALL,RUNNING,SUSPENDED,FAILED,COMPLETED. - Multi-tenant dropdown to isolate telemetry to a specific
$namespace. - High-level KPIs in
StatsOverviewshowing total runs, completed, failed, and suspended counts.
7. Attaching Workflows to Running Monitor Servers
Instead of creating a new HTTP server in every script or test, workflows can attach to a monitor server that is already running (e.g., started viasiglo monitor CLI, running in another container, or started once during service bootstrap).
Scenario A: Remote / Separate Process (CLI or Dedicated Server)
When your monitor server is running in a different process (such assiglo monitor --port 4000 in another terminal or Docker):
attachToMonitorServer automatically creates an asynchronous non-blocking HTTP telemetry dispatcher pointing to POST /api/events. Workflow execution is never delayed or blocked, and errors (such as temporary network disconnects) are handled gracefully in the background.
attachToMonitorServer dynamically handles five input targets:
attachToMonitorServer(): Attaches to the active in-process server singleton if present, otherwise defaults tohttp://127.0.0.1:4000.attachToMonitorServer(port): Attaches to an in-process server on that port if present, otherwise creates a client targetinghttp://127.0.0.1:<port>.attachToMonitorServer(url, clientOptions): Connects to a remote monitor URL over HTTP.attachToMonitorServer(instance): Directly pipes events intoinstance.emitterin memory.attachToMonitorServer(clientOptions): Passes customMonitorClientOptionsdirectly.
Scenario B: Same Process (In-Memory Singleton / App Bootstrap)
If your application boots the monitor server once at startup, other modules and workflows can attach directly without creating duplicate HTTP ports:Scenario C: High-Throughput Buffered Client
For high-throughput worker fleets, serverless functions, or background queues pushing events to a central monitor server, usecreateMonitorClient to configure event batching, authentication, and flush intervals:
8. CLI Dev Server Integration
With@siglo/cli, launch the live monitor server directly from your terminal:
9. Web Framework Middlewares
Embed the live monitoring UI and telemetry endpoints directly into your existing HTTP applications by sharing aWorkflowEventEmitter:
Express
Fastify
Hono
10. Distributed Transports & Streaming
Server-Sent Events (SSE)
Clients can subscribe to lightweight, one-way event feeds over standard HTTP with automated 15-second keep-alive heartbeats and an initial: connected handshake:
WebSockets (RFC 6455)
Connect via WebSocket on/ws for bi-directional communication, remote controls, and telemetry forwarding:
Distributed Redis Pub/Sub
For distributed clusters where workflows execute across multiple serverless functions or worker nodes:11. Production Telemetry: Prometheus & Grafana
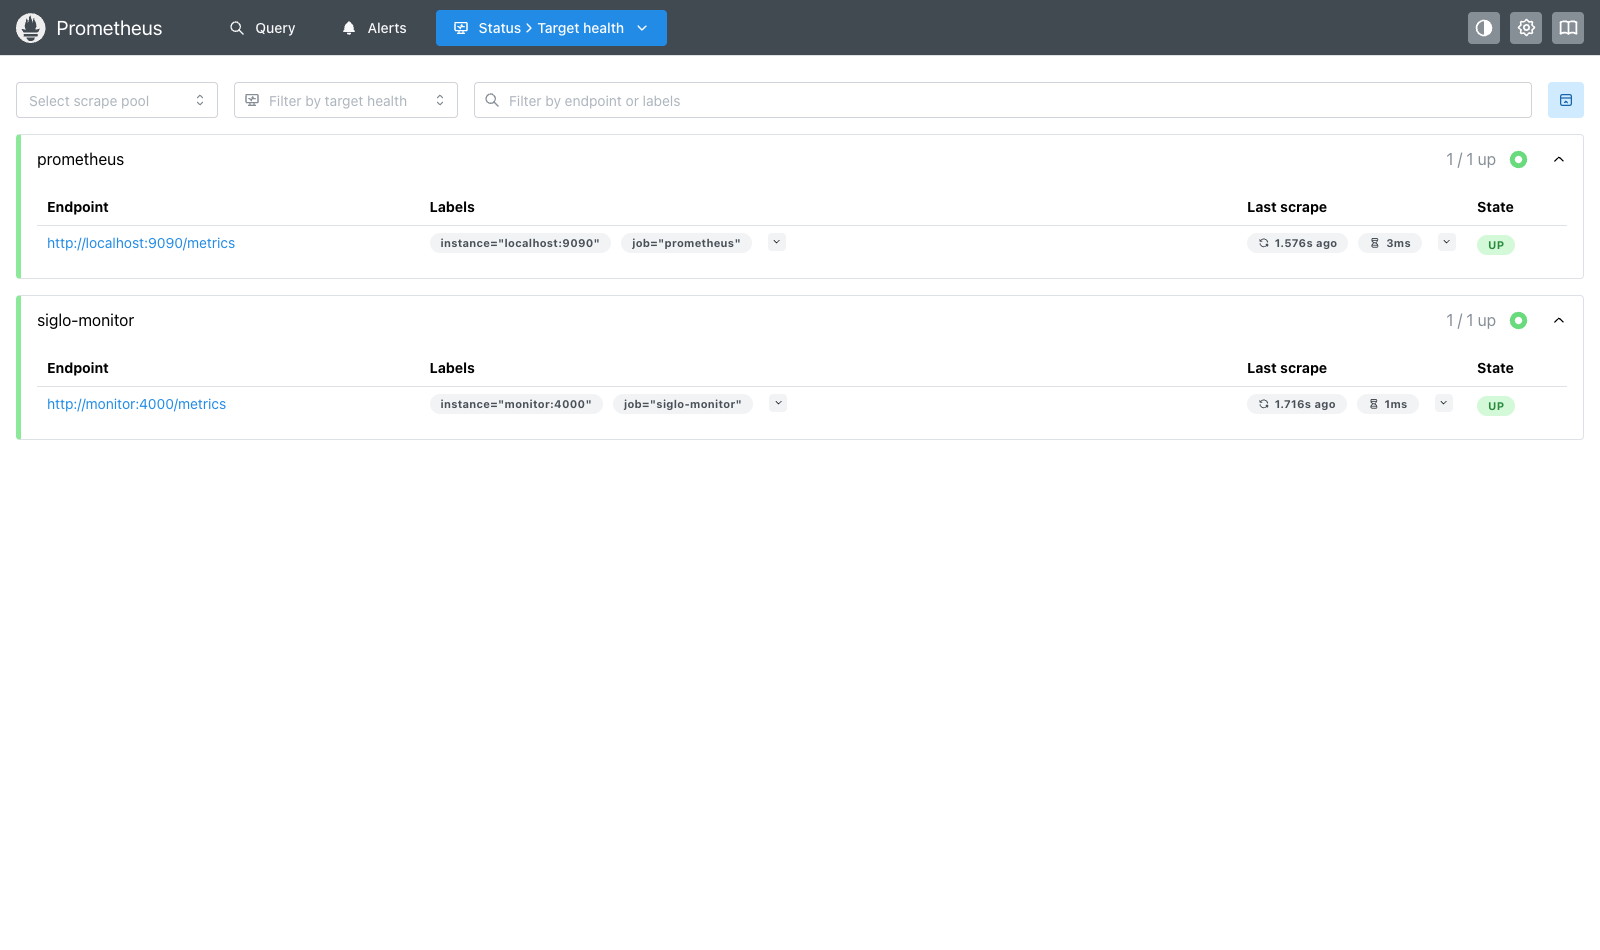
@siglo/monitor includes a built-in Prometheus metrics exposition endpoint on /metrics.
Exposed Metrics
Pre-Configured Grafana Dashboard
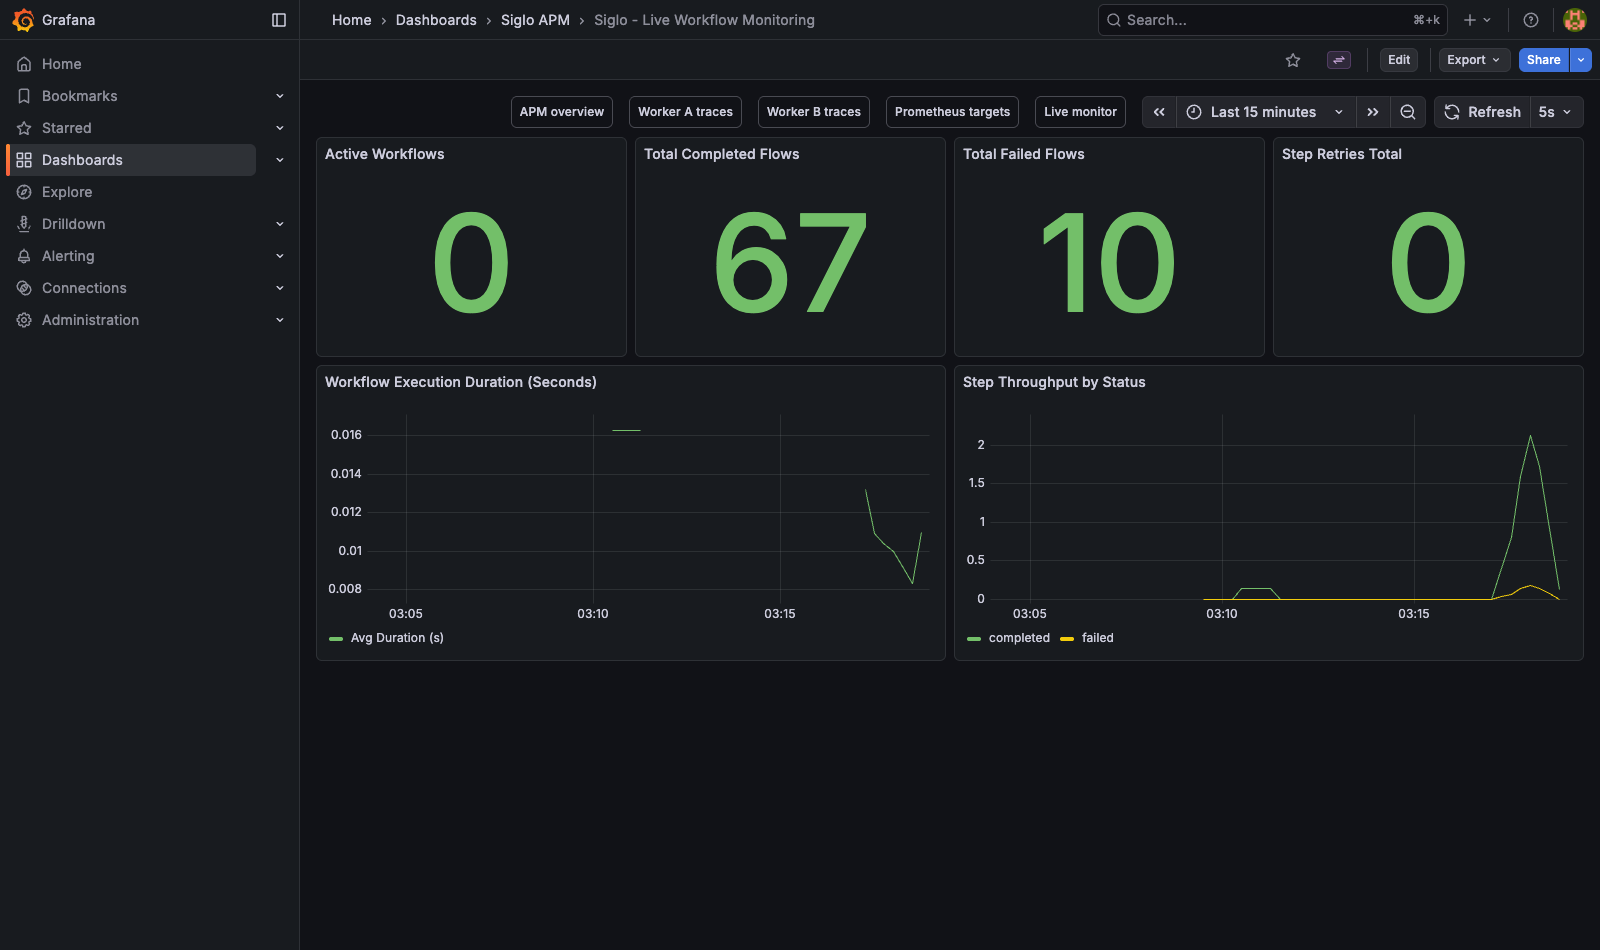
Import the JSON dashboard template located at:packages/monitor/grafana/siglo-live-monitoring.json (or node_modules/@siglo/monitor/grafana/siglo-live-monitoring.json).
Panels include:
- Active workflows gauge
- Total completed and failed flow counters
- Step retries counter
- Workflow execution duration time-series graph
- Step throughput breakdown
12. Security, Authentication & Production Hardening
Deploying@siglo/monitor in remote environments requires hardening to protect runtime state and prevent unauthorized access:
12.1 API Key & Token Authentication
Protect all endpoints with scoped API keys:read: Accesses DevTools UI, SSE/events, Prometheus/metrics, and/api/workflowsread endpoints.ingest: Authorizes telemetry ingestion viaPOST /api/eventsand WebSocket client event messages.control: Authorizes workflow resumption (POST /api/workflows/:stackId/resume) and replay (POST /api/workflows/:stackId/replay).
Authorization: Bearer <token>X-API-Key: <token>- Query parameter:
?token=<token>or?apiKey=<token>(useful for EventSource and WebSocket browser handshakes)
12.2 Disabling Remote Control in Sensitive Environments
In production environments, interactive workflow resumption (/resume) and replays (/replay) can be disabled entirely to enforce zero-trust immutability:
12.3 CORS Hardening
Prevent browser-based intranet CSRF by restricting access to explicit trusted origins:cors: { origin: false } to disable CORS headers entirely.
12.4 Ingestion Limits & Memory Protection
- Payload Size Caps: Requests exceeding
maxPayloadBytes(default: 1MB / 1,048,576 bytes) receive413 Payload Too Largeand are immediately destroyed to prevent denial-of-service memory exhaustion. - Inspection Structure Validation: All events submitted to
POST /api/eventsor over WebSocket are validated withvalidInspectionEventbefore ingestion. Invalid versions or malformed structures are rejected with400 Bad Request. - Bounded In-Memory Execution Store:
WorkflowExecutionStoreretains at most 1,000 runs, 500 events per run, and 200 context diffs per run by default, evicting oldest records on overflow. - Bounded Remote Client Buffer: Remote clients automatically evict oldest events if the buffer queue reaches
maxQueueSize(default: 1,000), preventing worker memory leaks during extended monitor server downtime.
12.5 Context Redaction & Ecosystem Sanitization
Automatic redaction runs before events are written to the store or broadcast over SSE/WS:- 31 Default Redacted Keys: Case-insensitive masking with
'[REDACTED]'for:rawBody,rawPayload,signature,signatureHeader,headers,cUrl,callbackBaseUrl,password,token,secret,apikey,authorization,cookie,creditcard,ssn,privkey,privatekey,recipient,email,phone,slackUserId,slackChannelId,discordWebhookUrl,approvalTokens,approveUrl,rejectUrl,signingSecret. - Custom Redaction Hooks: Add custom keys via
redaction.redactKeysor supply a value transformation hook viaredaction.redactHook(orsecurity.maskFn). - Ecosystem Content Suppression: During ecosystem step execution (or when a stack contains ecosystem content), general
context:changeandstep:completeoutputs are replaced with'[Content not captured]'and errors are generalized to prevent accidental credential leakage into standard context diffs. - Preview Sanitization: Notification email HTML previews are rendered inside a sandboxed
iframewith Content Security Policydefault-src 'none'; base-uri 'none'; form-action 'none'.
12.6 Network Egress Policy Compliance
When workflows enforce least-privilege network egress using Siglo’s ASL Network Egress Policy, ensure the remote monitor host is whitelisted:13. REST API Reference
The monitor server exposes standard REST endpoints for telemetry ingestion and DevTools control:14. Dashboard UI Architecture (packages/monitor/ui)
The live monitor web interface source code is located in packages/monitor/ui and follows an industry-standard React project structure:
- React 18 with TypeScript and functional hooks
- Vite with
vite-plugin-singlefilebundling - Tailwind CSS for dark-mode styling
- Lucide React icons
- Zero External Runtime CDN Dependencies: Fully inlined into
packages/monitor/src/ui/dashboard.tsvia build script (embed-html.js).